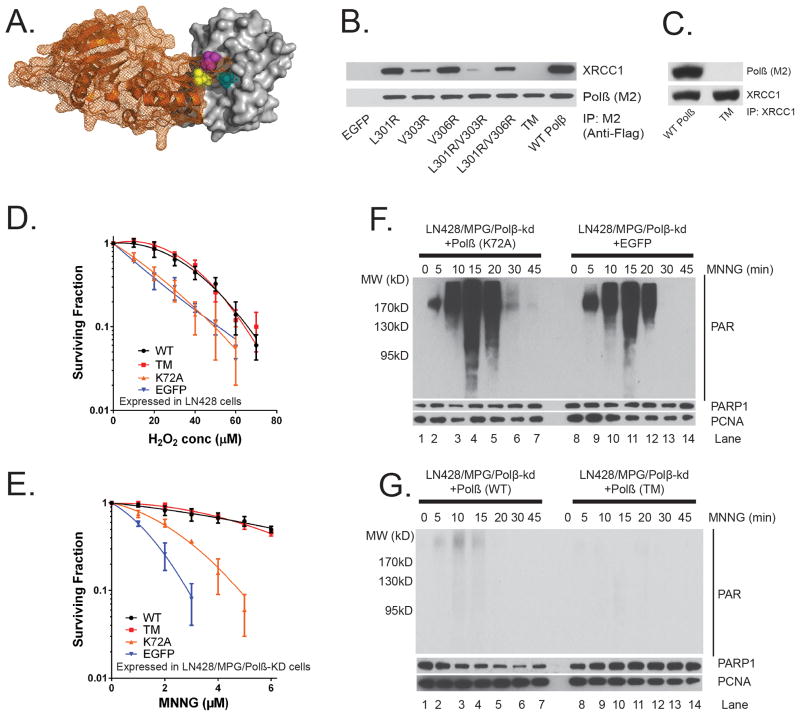
Figure 1. Complex formation between DNA polymerase β and XRCC1 is not essential for the cellular response to DNA damage.
(A) Structure (pdb3lqc) depicting oxidized XRCC1 (residues 1–151) bound to the Polβ(residues 142–335)9. The image is a cartoon rendition of the palm and thumb domains of Polβ in orange with a mesh illustrating the surface of the structure and a space-filling rendition of the oxidized form of XRCC1 in grey with a solid illustrating the surface of the structure. Amino acids L301 (yellow), V303 (cyan) and V306 (magenta) are shown using a space-filling rendering. The images were generated using PyMOL (Molecular Graphics System, Version 1.2r3pre; Schrödinger, LLC).
(B) Stable LN428 cell lines expressing Flag-Polβ(WT) or the V303 loop mutants were probed for Polβ/XRCC1 complex formation by IP of the lentiviral-expressed Flag-Polβ transgene via the N-terminal Flag epitope tag and probing for XRCC1 and Flag-Polβ by immunoblot (See also Supplementary Figure 9).
(C) Stable LN428 cell lines expressing Flag-Polβ(WT) or Flag-Polβ(TM) were probed for Polβ/XRCC1 complex formation by IP of XRCC1 (XRCC1-Ab) and probing for XRCC1 and Polβ by immunoblot.
(D) Cell viability of LN428 cells expressing Flag-Polβ(WT), Flag-Polβ(TM), Flag-Polβ(K72A) or EGFP (as indicated) after H2O2 treatment, as measured by the Long-term assay. Plots show the relative surviving fraction as compared to untreated (control) cells. Means are calculated from triplicate values in each experiment. Results indicate the mean ± SD of three independent experiments.
(E) Cell viability of LN428/MPG/Polβ-KD cells expressing Flag-Polβ(WT), Flag-Polβ(TM), Flag-Polβ(K72A) or EGFP (as indicated) after MNNG treatment, as measured by the MTS assay 48 hours after exposure. Plots show the relative surviving fraction as compared to untreated (control) cells. Results indicate the mean ± SD of three independent experiments.
(F) Immunoblot of PAR to determine activation of PARP after exposure to MNNG (5μM) for the time indicated for LN428/MPG/Polβ-KD cells expressing Flag-Polβ(K72A) (left panel) or EGFP (right panel). PARP1 and PCNA protein expression levels are also shown as loading controls.
(G) Immunoblot of PAR to determine activation of PARP after exposure to MNNG (5μM) for the time indicated for LN428/MPG/Polβ-KD cells expressing Flag-Polβ(WT) (left panel) or Flag-Polβ(TM) (right panel). PARP1 and PCNA protein expression levels are also shown as loading controls.

