
Figure 2.
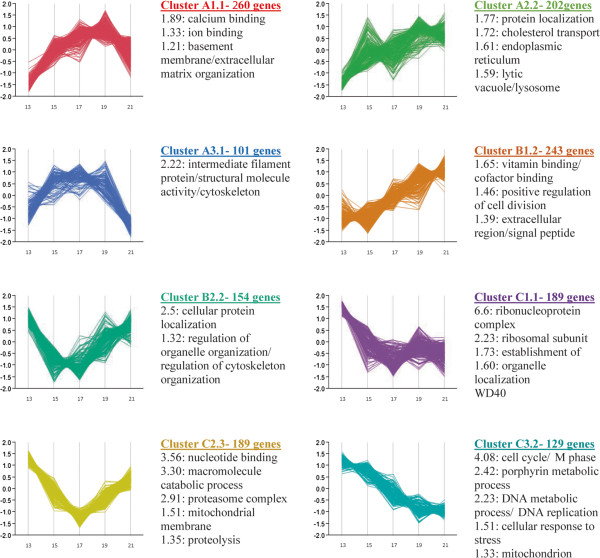
Further partitioning and functional annotation analysis to genes clustered together according to their temporal expression pattern. DAVID annotation analysis and enrichment scores for 8 selected clusters (out of 21) and a graphical representation of their gene expression. The full-version figure with functional annotation analysis and graphics for all 21 clusters is available as Additional file 3.