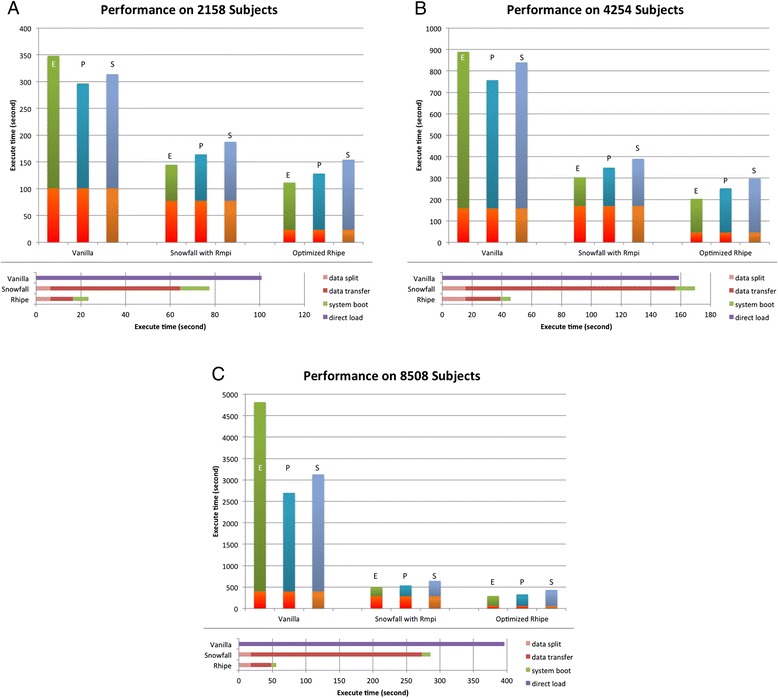
Figure 7.

Performance on the macro-benchmark. This is the performance evaluation using vanilla R, optimised Snowfall and optimised RHIPE package. The upper part of each figure indicates the total execution time. In this part, the bottom three bars in each method shows the data preparation time; while the upper three bars respectively indicate the Euclidean (E), Pearson (P) and Spearman (S) calculation time. The lower part of each figure details the data preparation of each method. In this part, data split shows the time used for splitting the large data matrix into smaller pieces, data transfer for the Snowfall shows data copy time for the pieces to corresponding MPI workers, data transfer for the RHIPE shows the data uploading time for the same pieces to HDFS, system boot respectively shows the boot time of the MPI cluster and the Hadoop cluster, and the direct load shows the data loading time for vanilla R. A: Performance on ONCOLOGY dataset. (2158 subjects). B: Performance on the cross-study consisting of ONCOLOGY and LEukemia (4254 subjects). C: Performance on the large artificial dataset (8508 subjects).
