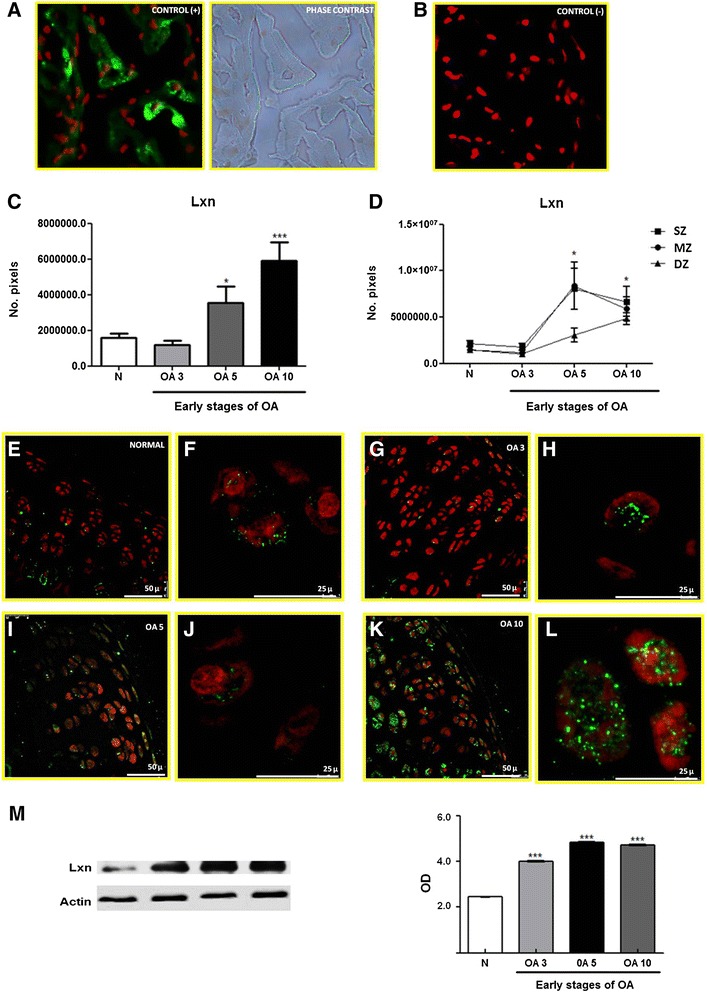
Figure 4.

Expression and localization of Lxn in normal articular cartilage during the early stages of OA in a rat model. (A) Positive control and phase contrast microscopy for Lxn expression in rat heart tissue. (B) Negative control for Lxn expression in rat heart tissue. (C) Number of pixels, expressed as area of Lxn in the total cartilage. (D) Expression of Lxn in the 3 zones (SZ, MZ, and DZ) in normal and osteoarthritic cartilage. (E, G, I, and K) Lxn expression in normal articular cartilage and OA at 3, 5, and 10 days (F, H, J, and L), perinuclear and cytoplasmic localization of Lxn in normal articular cartilage and OA at 3, 5, and 10 days (amplification of panel E, G, I, and K). (M) Representative western blot of Lxn expression in normal and OA cartilage during early stages (3, 5, and 10 days). The densitometry graph shows the protein levels of Lxn measured by optical density (OD) normalized to β-actin. The results show the means ± S.E.M. of 3 independent experiments using a Tukey-Kramer multiple comparison test. Significant differences are represented by asterisks (*p < 0.05, **p < 0.01, ***p < 0.001).
