
Figure 1.
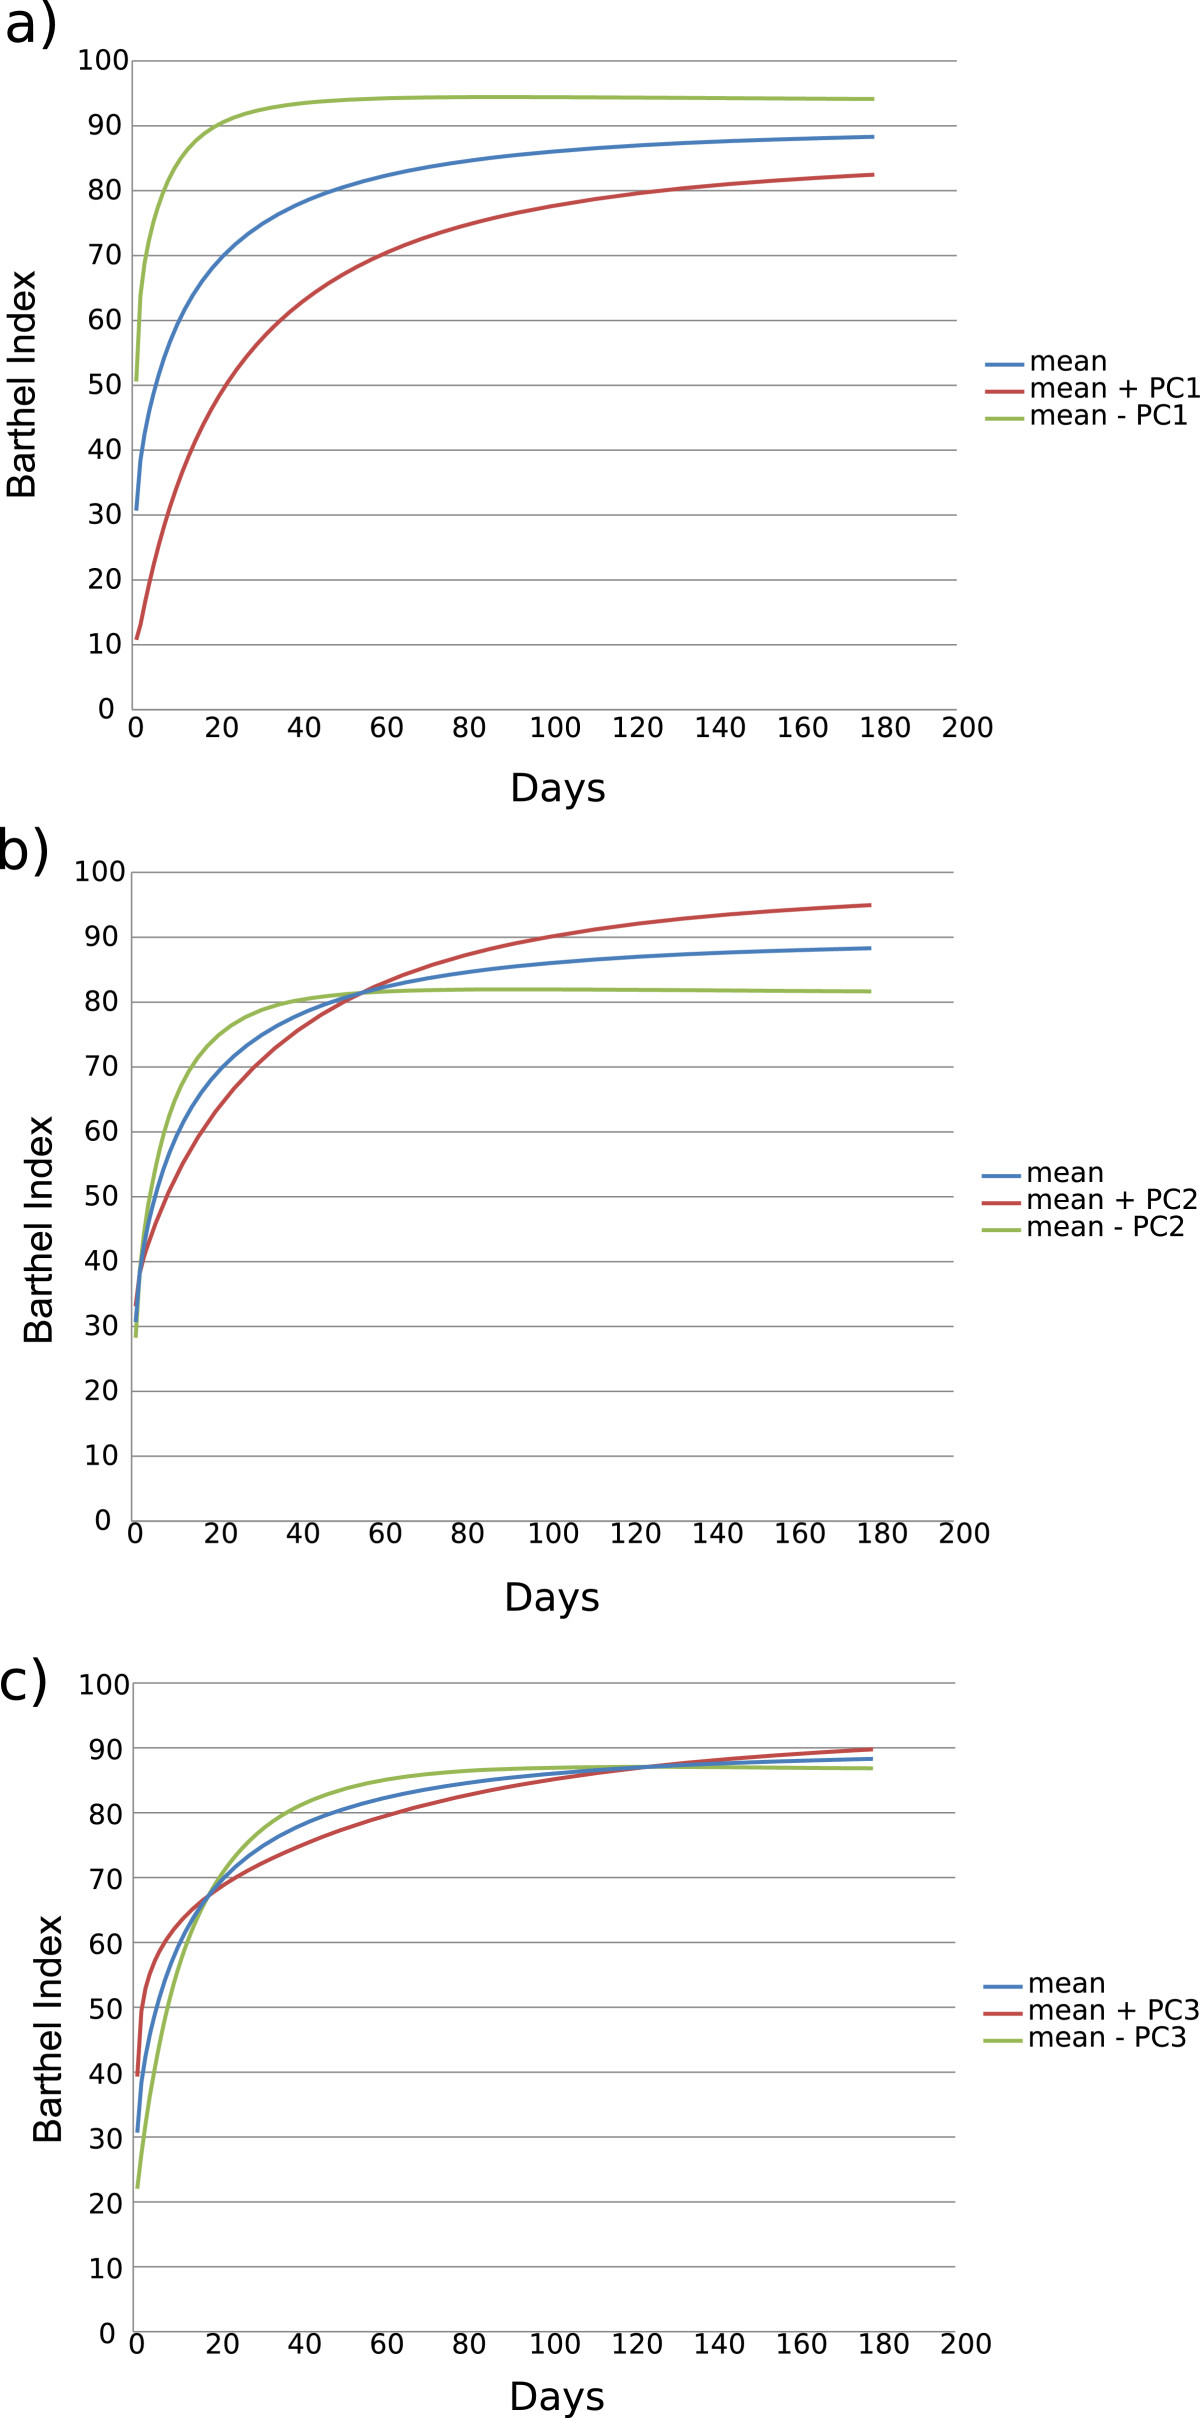
FPCs for recovery process (BI). The mean of functional recovery (BI) is shown with curves created by adding (red line) and subtracting (green line) to the mean the standard deviation of scores of FPC1 (a), FPC2 (b), FPC3 (c).
Official websites use .gov
A
.gov website belongs to an official
government organization in the United States.
Secure .gov websites use HTTPS
A lock (
) or https:// means you've safely
connected to the .gov website. Share sensitive
information only on official, secure websites.
FPCs for recovery process (BI). The mean of functional recovery (BI) is shown with curves created by adding (red line) and subtracting (green line) to the mean the standard deviation of scores of FPC1 (a), FPC2 (b), FPC3 (c).