
Figure 3.
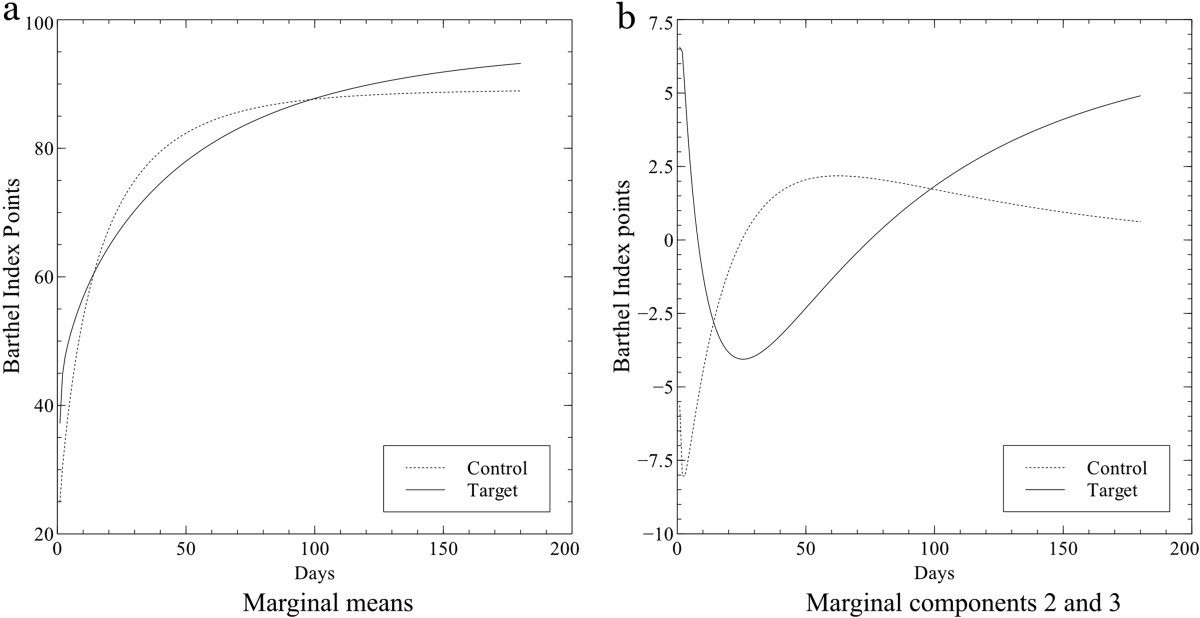
Differences in the recovery dynamics from FPC2 and FPC3. Differences in the recovery dynamics between groups can be observed in this figure. Reconstructed curves from the marginal mean components per group obtained in the FPCA showed that target group has a trend of improvement after six months of stroke while control group did not have it (a). Differences in dynamics are more evident when just the functional principal components 2 and 3 are reconstructed (b).