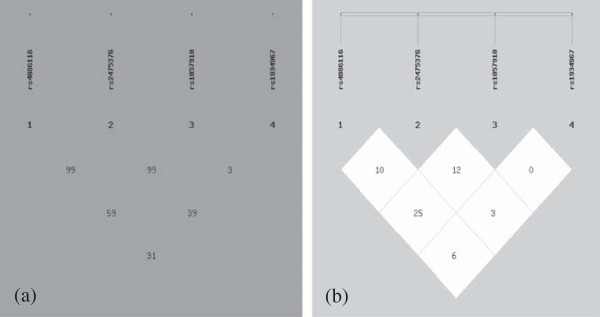
Figure 2.

Pairwise estimates of linkage disequilibrium (LD) between each CYP2C9 polymorphism is plotted for Han population using SHEsis platform. Each polymorphism is numbered according to its position in the CYP2C9 gene as presented in Figure 1. (a) showed | D'| and different colors represent different degree of linkage disequilibrium. The darker the color,wasthe stronger the degree of linkage disequilibrium was (b) showed r2.
