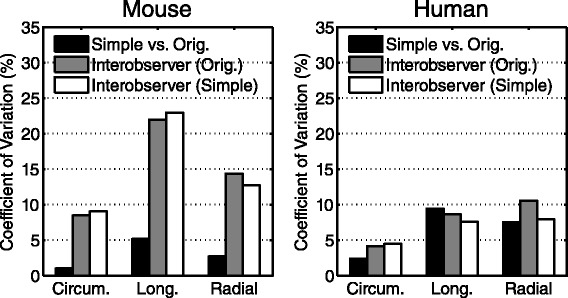
Figure 5.

Coefficient of variation between peak strain values. There was superior agreement between the simplified and original analysis (black bars) compared to the inter-observer agreement from the original analysis (gray bars). The inter-observer agreement of the simplified analysis (white bars) was comparable to that of the original analysis in mice (left) and humans (right).
