
Figure 1.
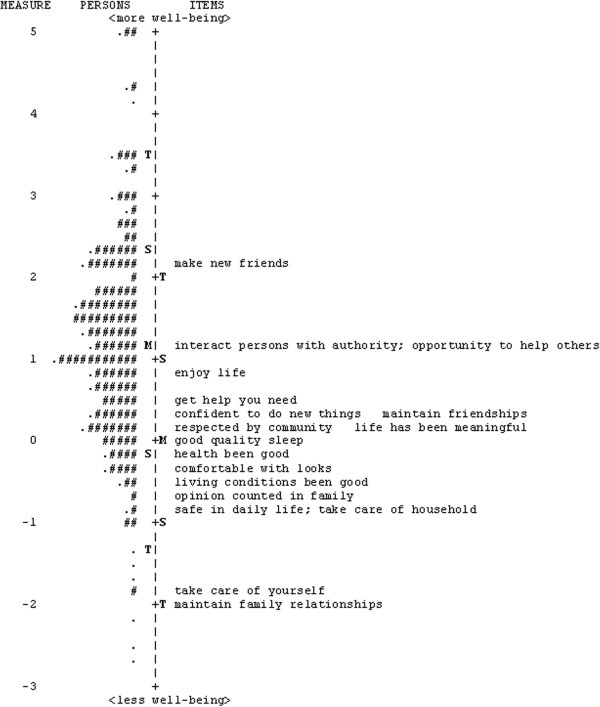
Person-item map for the RAD section 4 (well-being) for Bangladesh sample. To the left of the dashed line are the persons, represented by “#” and “.”, and on the right are the items. Each “#” represents 3 persons and each “.” represents 1 to 2 persons. Participants with higher well-being scores and items targeting higher levels of well-being are near the top of the diagram, while individuals with lower well-being scores and items targeting lower levels of well-being are near the bottom. M = mean; S = 1 standard deviation from the mean; T = 2 standard deviations from the mean.