Figure 1.

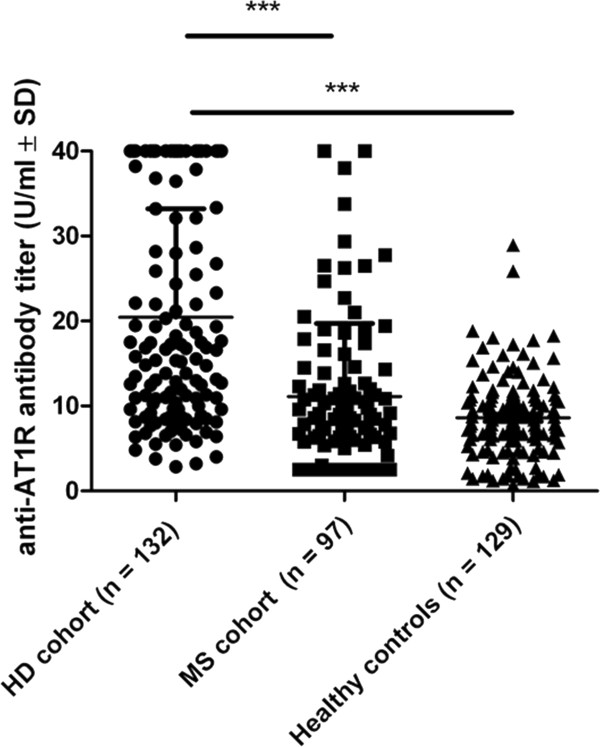
Dot plot graph showing anti-AT1R antibody titers (U/ml) in HD individuals (n = 132), MS patients (n = 97) and healthy controls (n = 129).

Dot plot graph showing anti-AT1R antibody titers (U/ml) in HD individuals (n = 132), MS patients (n = 97) and healthy controls (n = 129).