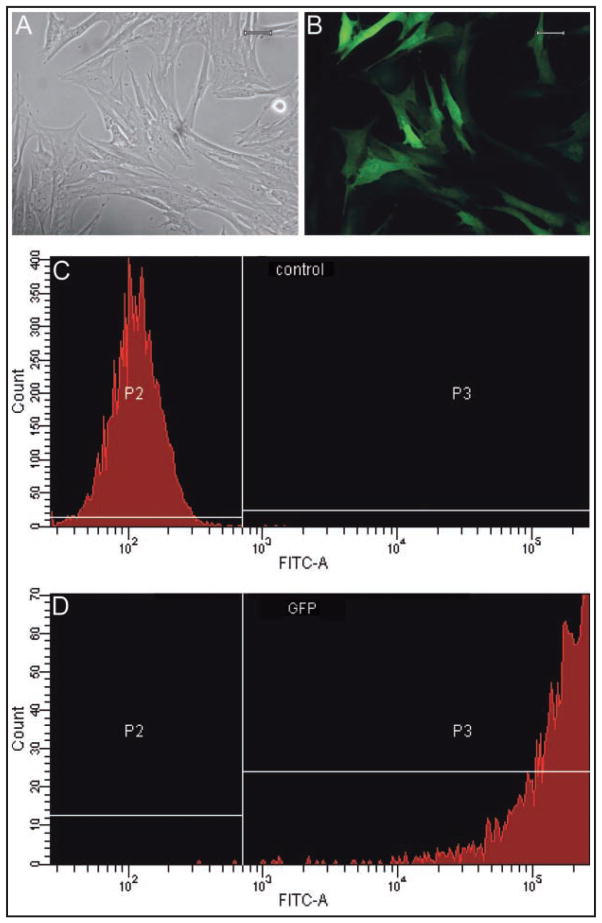
Figure 2.
Photomicrographs of SDFTNs (A; light microscopy; bar = 20 μm) seen as GFP-positive cells via fluorescent microscopy (B; bar = 20 μm). Quantitative assessment of transduction efficiency via flow cytometry analysis; representative scatterplots of control SDFTNs (C) and SDFTN-GFP cells (D) are illustrated. Notice > 95% transduction efficiency in SDFTN-GFP samples. P2 = Region of cells lacking detectable fluorescent activity on the FITC-A channel. P3 = Region of detectable fluorescent activity in analyzed cells. FITC-A = Designated laser used to detect fluorescent activity. Y-axis = Channel numbers detected by use of the indicated laser. X-axis = Number of cells analyzed.

