Figure 4.

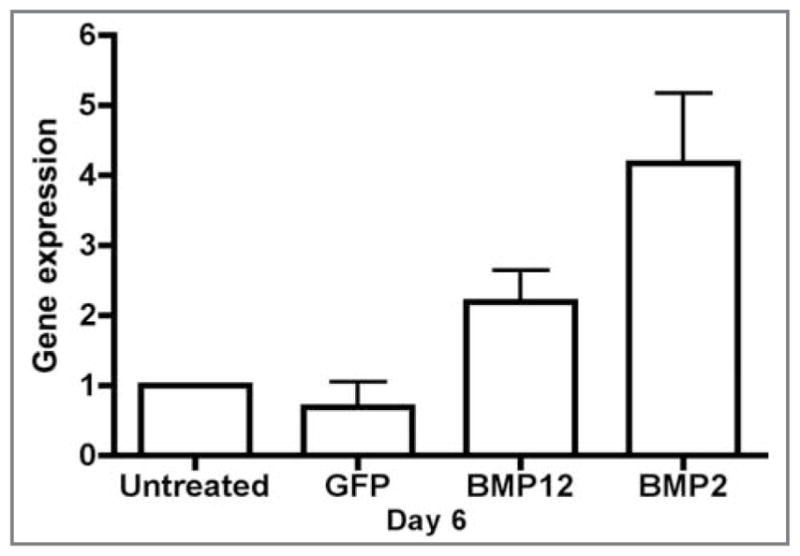
Graph of gene expression (via RT-qPCR assay) for alkaline phosphatase in equine BMDMSCs. On cell culture day 6, the value for BMDMSC-BMP2 cells was significantly (P < 0.01) greater, compared with results for other groups.

Graph of gene expression (via RT-qPCR assay) for alkaline phosphatase in equine BMDMSCs. On cell culture day 6, the value for BMDMSC-BMP2 cells was significantly (P < 0.01) greater, compared with results for other groups.