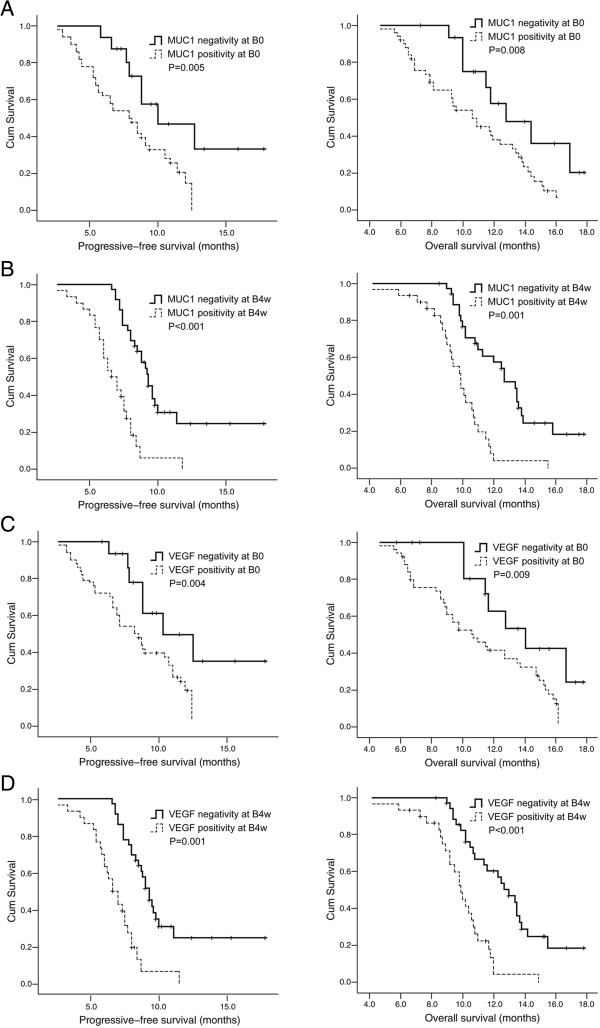
Figure 3.

Kaplan-Meier curves of progression-free survival (PFS) and overall survival (OS). (A and B) PFS and OS curves according to the positivity or the negativity of MUC1 mRNA in blood of NSCLC patients before (B0) and 4 weeks after the start of treatment (B4w). (C and D) PFS and OS curves according to the positivity or the negativity of VEGF mRNA in blood of NSCLC patients at B0 and B4w time points.
