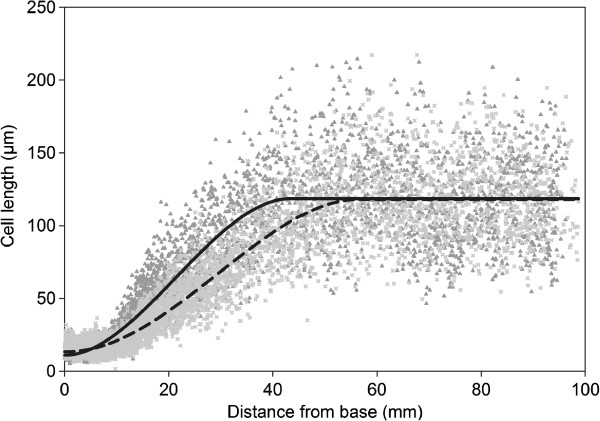
Figure 4.

Effect of GA20ox1 overexpression on the cell length profile of the 4 th leaf in maize. The cell length profile along the axis of the 4th leaf is shown for three non-transgenic (triangle, dark gray) and three transgenic (x, light gray) plants. The S-shaped curves are function plots using the mean values of the fitted function parameters for non-transgenic (full) and transgenic (dashed) profiles.
