Figure 3.

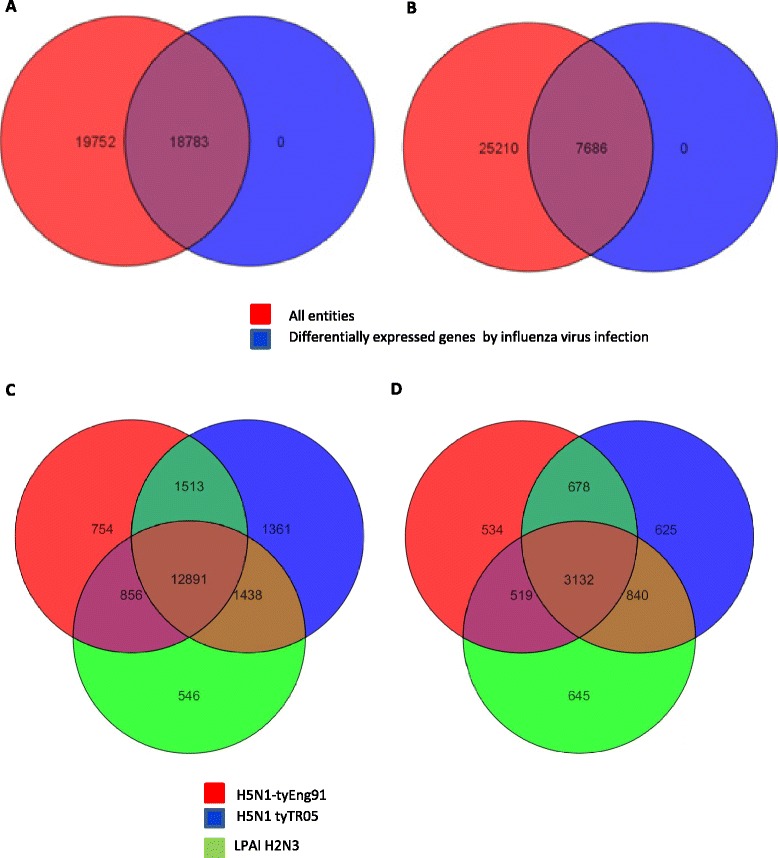
Summary of global gene expression in chicken and duck cells in response to influenza virus infection. Combined gene expression profiles of virus infected (all three avian viruses combined) and mock-infected samples showed that 18 783 out of 38 535 transcripts (48.74%) were significantly differentially regulated (P < 0.05) in chicken cells (A) while only 7686 out of 32 896 transcripts (23.36%) were significantly differentially regulated (P < 0.05) in duck cells (B) at 24 h following virus infection. Venn diagram overlap of significantly differentially regulated genes with a fold change of ±1.3 (≥ 1.3 fold, p ≤ 0.05) in (C) chicken cells and (D) duck cells at 24 h following infection with H5N1-tyEng91 (red), H5N1 tyTR05 (blue) or LPAI H2N3 (green) viruses.
