
Figure 6.
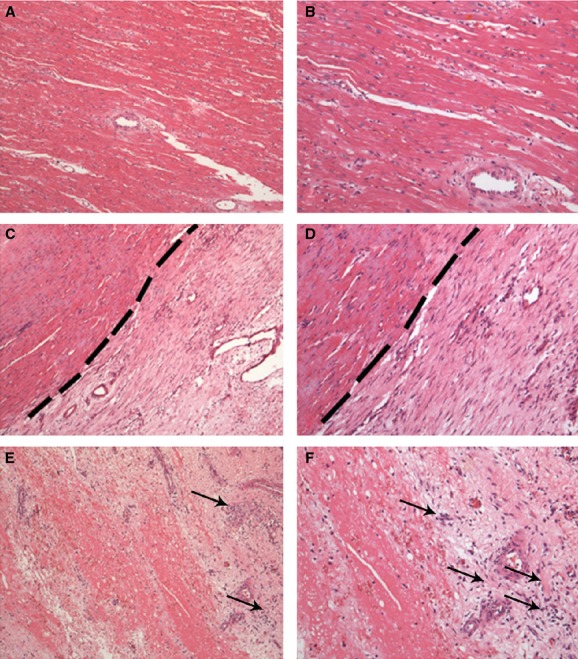
Histological diagnosis of MI 30 days after LCx occlusion. (A and B) Longitudinal section of remote area of MI (septum wall). Note organization of the cardiac muscle fibers. (C and D) Longitudinal section of border area of MI. Note that in dashed line there is clear differences in organization and composition of cardiac tissue. (E and F) Longitudinal section injured area (posterior wall). Note the complete disruption of the cardiac muscle fibers and inflammatory infiltrated cells (black arrows). All sections were stained with H&E (A, C and E – 100 × magnification, and B, D and F – 200 × magnification), n =15.