Figure 3.

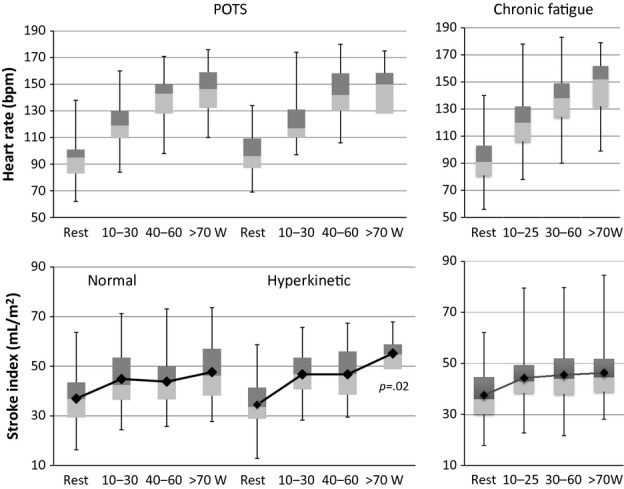
Box and whisker plots of HR (above) and stroke volume index (below) at rest, and during progressive exercise shown separately for normal and hyperkinetic cardiac output groups of POTS patients; and for patients with chronic fatigue.

Box and whisker plots of HR (above) and stroke volume index (below) at rest, and during progressive exercise shown separately for normal and hyperkinetic cardiac output groups of POTS patients; and for patients with chronic fatigue.