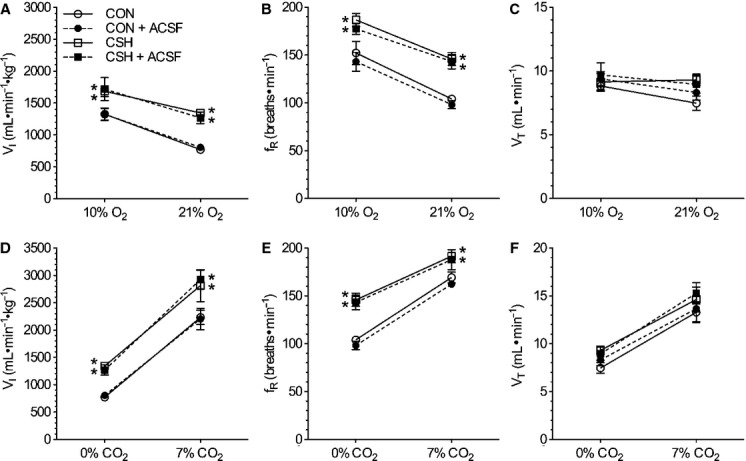
Figure 3.

Effects of chronic hypoxia and sham acute ACSF injections on ventilatory responses to O2 and CO2. Effect of hypoxia and ACSF microinjections on (A) total minute ventilation ( i), (B) breathing frequency (fr), and (C) tidal volume (Vt). Effect of hypercapnia and ACSF microinjections on
  i (D), fr (E), and Vt (F). Data are mean ± SEM from n =7 CON and 9 CSH rats. Asterisks (*) indicate significant (P < 0.05) difference between CON and CSH values.
