
Figure 5.
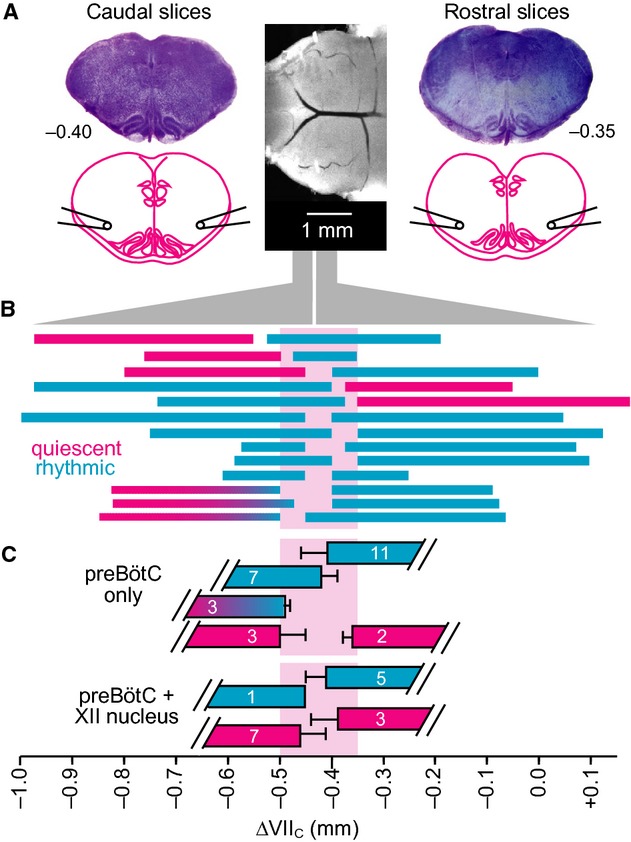
Electrophysiological recording of inspiratory rhythms in sandwich slices. (A) Central photograph shows the ventral brainstem prior to sectioning. Photographs in the left and right panels show consecutive “sandwich” slices exposed at the appropriate surface to obtain electrophysiological field recordings from the preBötC and XII. (B) Rostrocaudal borders of rhythmic and nonrhythmic sandwich slices. Abscissa at bottom shows distance relative to VIIc. Thirteen slice pairs are illustrated: cyan represents respiratory active slices, whereas magenta indicates quiescent slices. Cyan‐to‐magenta blended bars reflect slices that started out rhythmically active but progressively ceased rhythmic activity over 30–70 min. (C) Mean (±SD) borders of rhythmic and arrhythmic preBötC field recordings are shown with corresponding mean (±SD) borders for slices with active or silent XII field recordings.