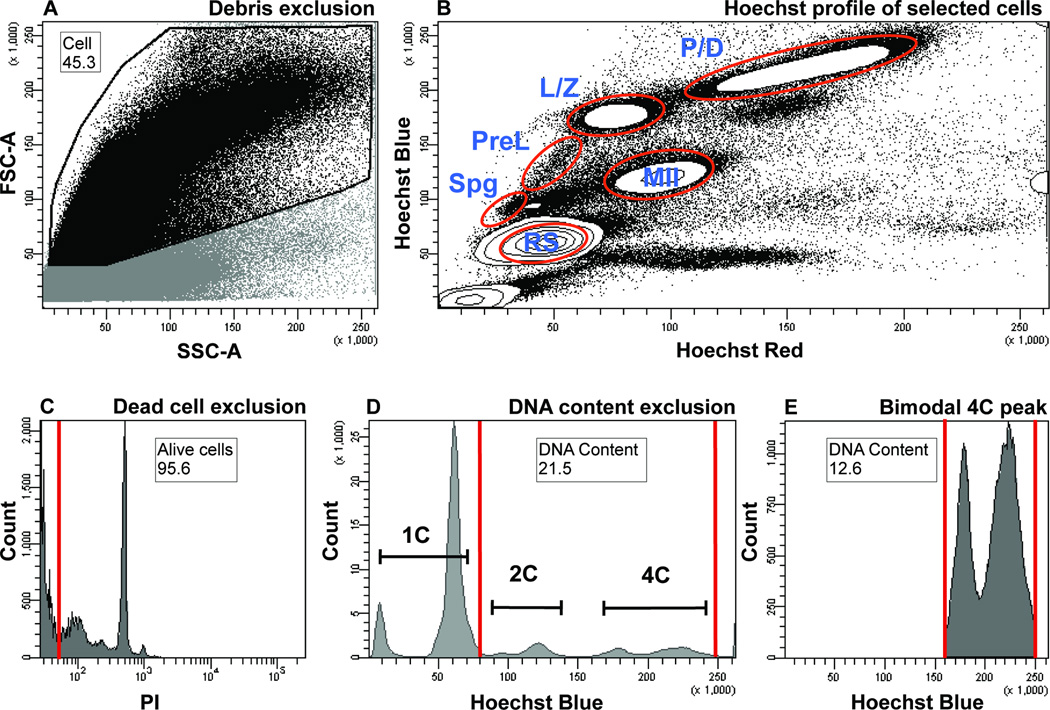
Figure 1.
Flow cytometric analysis of adult murine testicular cells based on Hoechst and PI fluorescence and light scattering parameters. Numbers on plots represent percent of parent population, the latter identified within a figure legend below. Gate name is found above the number. Both, the number and the gate name are encased by black box.
A) Debris exclusion based on low light scattering parameters. Cells are distinguished from debris based on the FSC and SSC, proportional to the cell size and cell granularity, respectively. A dot plot shows debris exclusion gate (“Cell” gate, black outline) that includes the cells (black dots) and excludes the debris (grey dots), which exhibit low FSC intensity. The excluded region also contains some elongated spermatozoa, whose small size is a major contributor to the low FSC signal. The parent of the “Cell” gate includes all the cells.
B) Hoechst profile of testicular cells. Cells selected in Figure 2A are visualized in a “Hoechst Blue”/“Hoechst Red” contour plot, in which the density of the cells is displayed as contour lines that form circular contours upon high cell density. The main subpopulations visualized are contained within the white densities outlined in red. Spg, spermatogonia; PreL, preleptotene spermatocytes; L/Z, leptotene/zygotene spermatocytes; P/D, pachytene/diplotene spermatocytes; MII, meiosis II spermatocytes; RS, round spermatids.
C) Dead cell exclusion based on PI fluorescence. Alive, PI-negative cells are found within an “Alive cells” gate to the left of the red line and include over 94% of all cells (most are pushed off the x-axis). Cells positive for PI (to the right of the red gate) are excluded from the analysis. The parent of the “Alive cells” gate is the “Cell” gate from Figures 1A and 1B.
D) DNA content exclusion based on “Hoechst Blue” fluorescence. Populations that fall within the red gate called “DNA Content” are included in the analysis (2C and 4C DNA contents are labeled). Haploid cells with 1C DNA content are outside of the gate and are excluded from the analysis. The parent of the “DNA Content” gate is the “Alive cells” gate from figure 1C. In this example, the “DNA Content” gate represents 43.3 percent of all cells.
E) Bimodal distribution of cells with 4C DNA content shows L/Z and P/D populations. The left and right peaks encompassed by the red gate (a restricted “DNA Content” gate) correspond to L/Z and P/D populations, respectively. The parent of the “DNA Content” gate is the “Alive cells” gate from figure 1C. In this example, the restricted “DNA Content” gate represents 5.4 percent of all cells.

