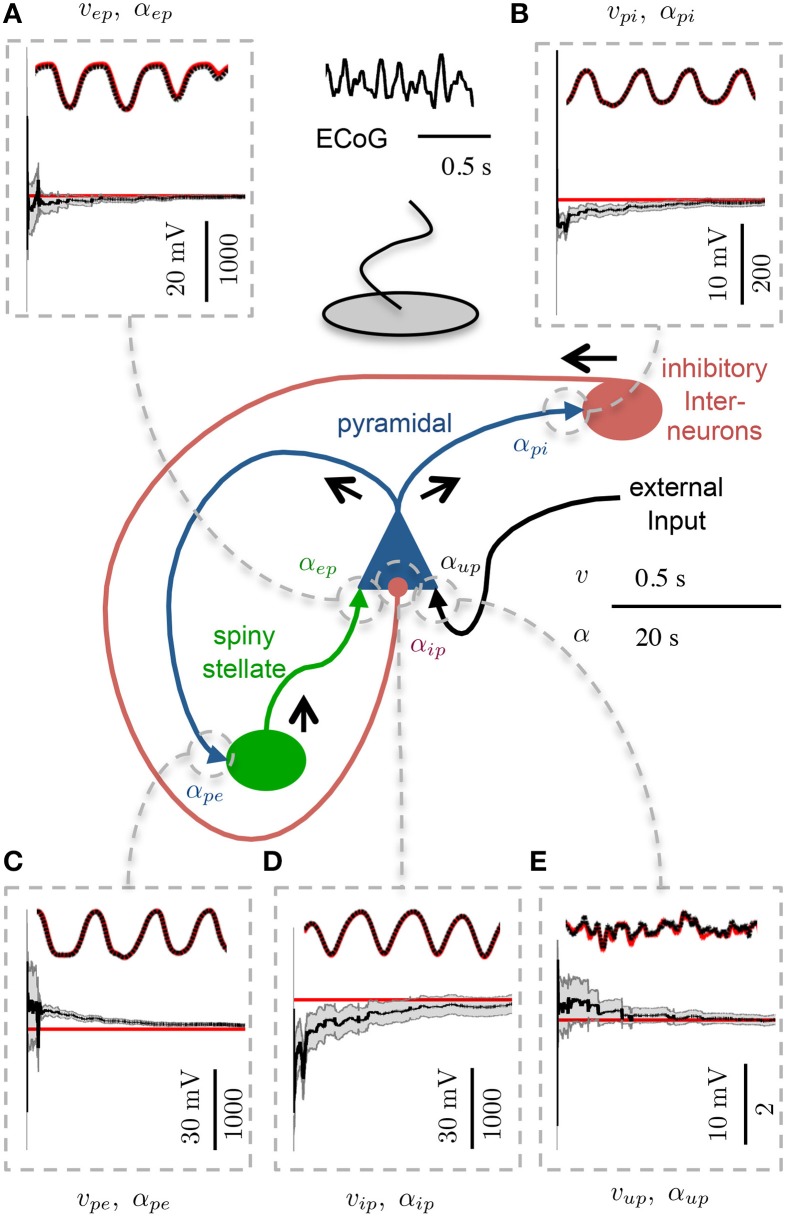
Figure 4.
Estimation results showing convergence of parameters in the single region model. 30 s of ECoG data simulating an alpha rhythm from a single region model was used. Each panel shows the PSP (upper) and connectivity gain (lower) estimates. The actual states are shown in red and the estimated values are shown in black. The gray shaded regions show the estimated standard deviation estimates of the connectivity gains. The scale in the lower left of each subpanel is distinct for the PSP (LHS) and connectivity gain (RHS) (A) PSP and connectivity gain for spiny stellate to pyramidal connection. (B) PSP and connectivity gain for pyramidal to inhibitory interneuron connection. (C) PSP and connectivity gain for pyramidal to spiny stellate connection. (D) PSP and connectivity gain for inhibitory interneuron to pyramidal connection. (E) PSP and connectivity gain for external input to pyramidal connection.

