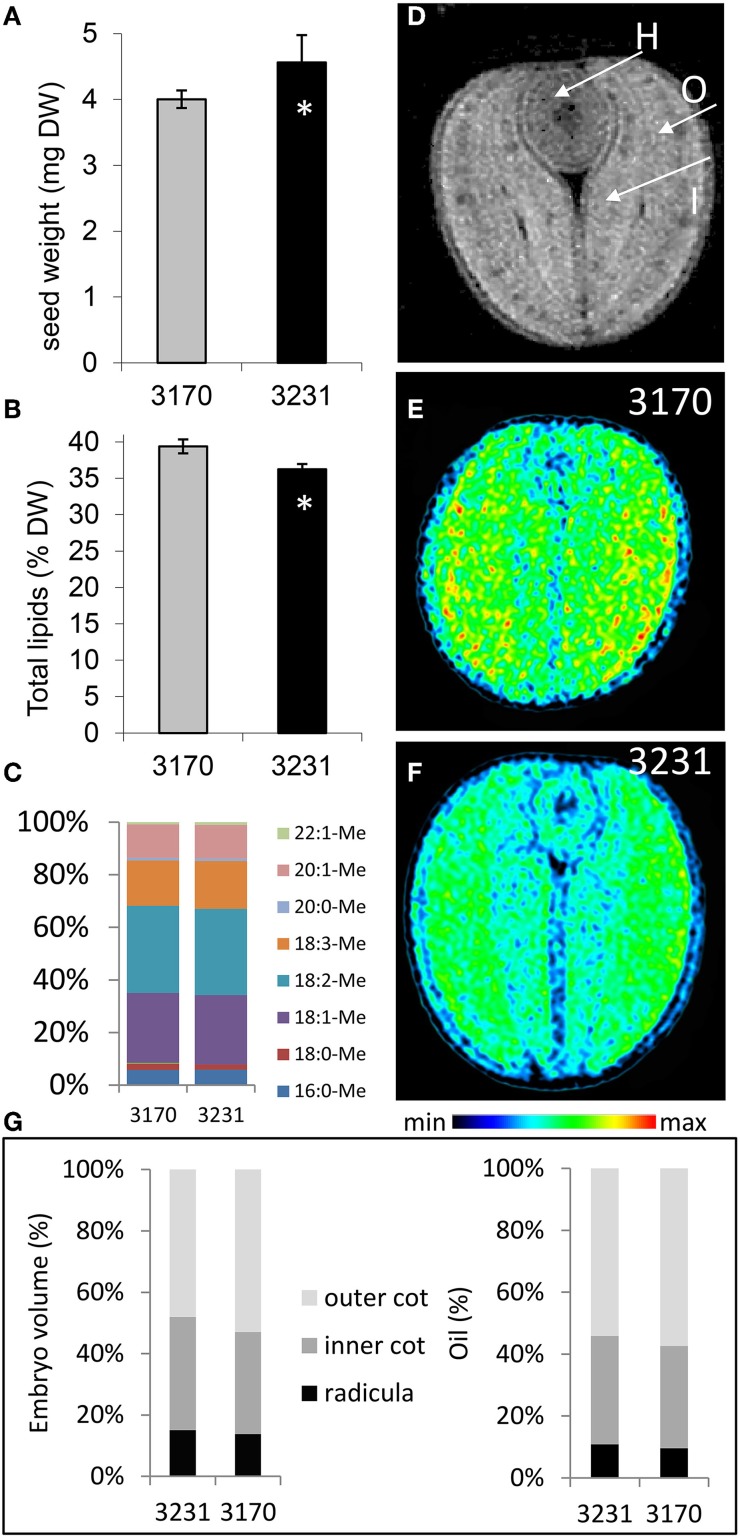
Figure 1.
The seed of oilseed rape accessions 3170 and 3231. (A) Seed weight, (B) total lipid content (expressed as % of dry weight), (C) individual fatty acid profile (expressed as % of total fatty acids). (D) A cross-sectional MRI-based image showing the hypocotyl [H], the outer cotyledon [O] and the inner cotyledon [I]. MRI-based imaging of lipid distribution in the mature seed of accessions (E) 3170 and (F) 3231. Rainbow color scale indicates relative lipid concentration for images in (E,F). (G) The relative contribution to both embryo volume and total stored lipid of the radicula, inner and outer cotyledon; calculation was based on MRI data. Bars in (A,B) represent the mean of 10 samples of four seeds. +/− indicates the standard deviation of the mean. The star (*) indicates statistical significance (t-test, p < 0.05).

