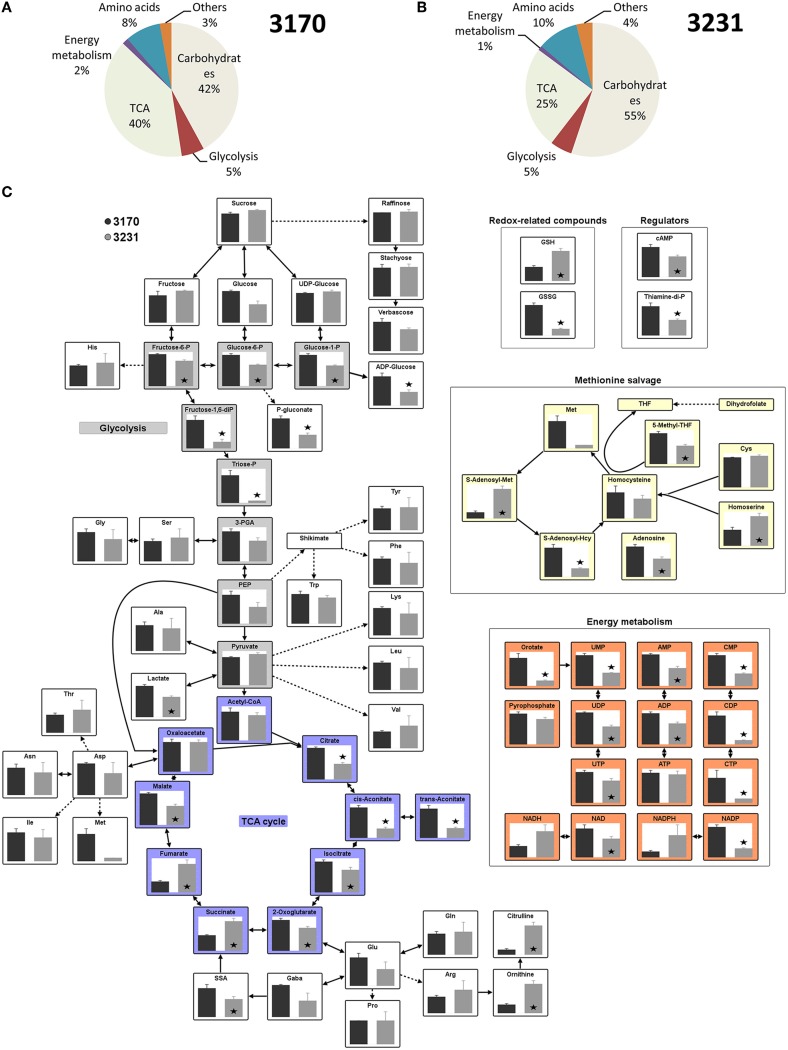
Figure 2.
Metabolites produced by in vitro cultured embryos of two oilseed rape accessions. (A,B) The relative pool sizes across all metabolites in accession (A) 3170 and (B) 3231. (C) Steady state metabolite levels of the high lipid accumulator accession 3170 (black bar) and the low lipid accumulator accession 3231 (gray bar), as measured by liquid chromatography/mass spectrometry. The standard error was calculated from measurements taken from five technical replicates per each of three biological replicates. Asterisks indicate means differing significantly (p < 0.05, t-test) between accessions.

