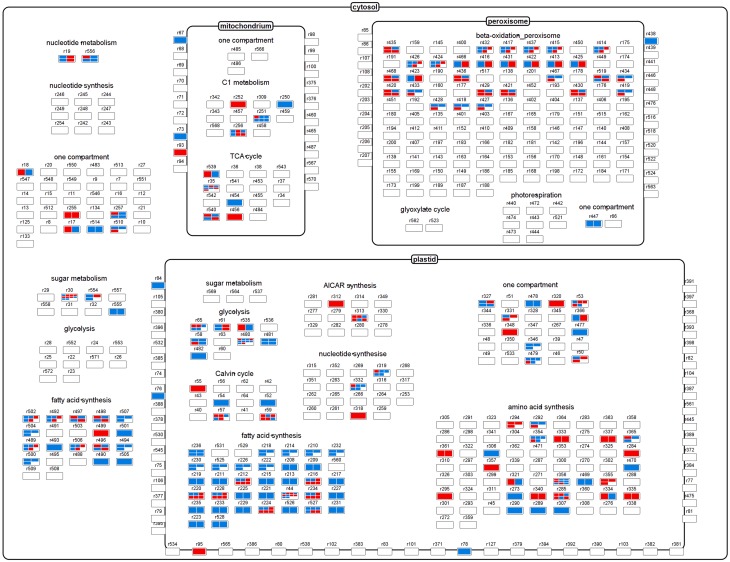
Figure 5.
The central metabolism, showing relevant reactions and transporters as nodes. The heatmaps within each node correspond to differentially transcribed Brassica transcript IDs encoding enzymes/proteins related to the node's reaction. Red elements indicate a congruent fold change in both flux and transcript abundance, while blue ones indicate an opposed fold change.

