Figure 3.
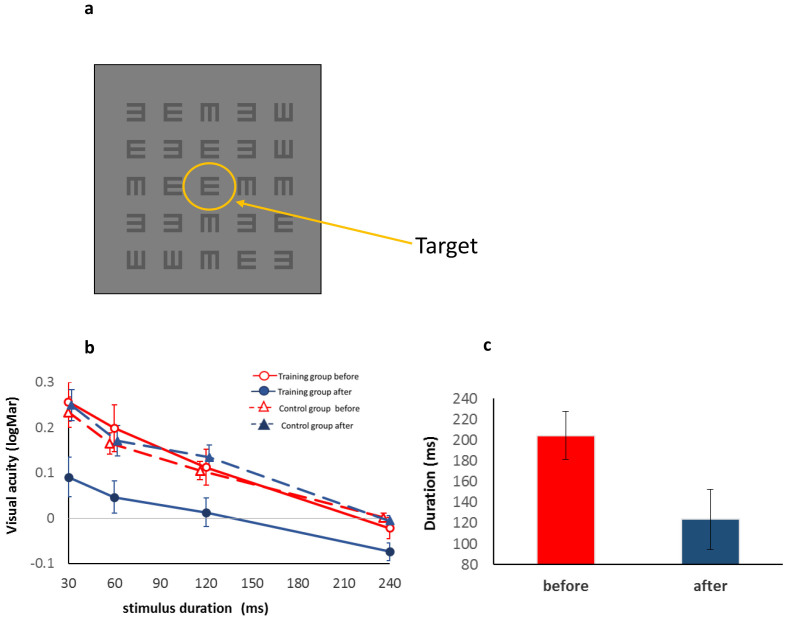
Reduced crowding and improved processing speed following training: (a) Stimulus example; E target (center) surrounded by E masks. (b) Visual acuity (VA) under crowded conditions in logMAR units (a minimal angle of resolution, y axis) as a function of the presentation time (x axis) in the pre-training (first) and post-training (second) testing sessions for the training and control groups. VA of the smallest target is presented in logMAR units. The zero line denotes a VA of 6/6 (a log minimal angle of 1). The training group is denoted by solid lines and circles. The control group is denoted by dashed lines and triangles. Open symbols and red lines stand for the pre-training results, and filled symbols and blue lines denote the post-training results. The control group's second testing after a break lasted as long as the training period. Following training, the trained group improved significantly for all durations, whereas the control group did not (see Results). (c) Reduced stimulus duration required to reach a VA of 6/6 (0 logMAR on the Y axis) following training. Whereas before training, the average exposure duration required to reach a VA of 6/6 was 204 ms (red bar), after training this exposure duration was reduced to 123 ms (blue bar). Error bars denote SEM (trained group: n = 14, controls: n = 19).

