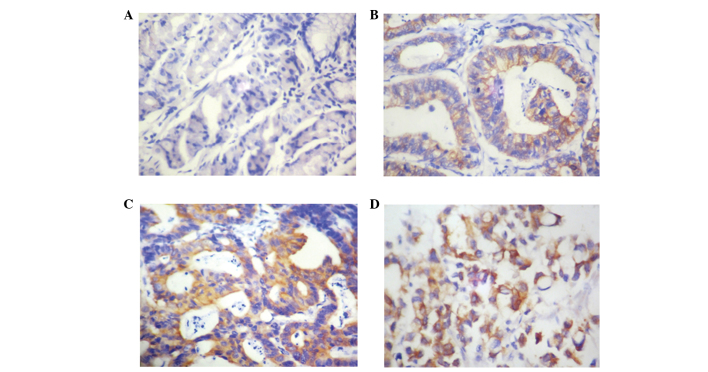
Figure 1.
Expression pattern of 14-3-3σ in gastric cancer. (A) No 14-3-3σ expression in healthy gastric tissues. (B) Overexpression of 14-3-3σ in the cytoplasm of well-differentiated gastric cancer cells. (C) High 14-3-3σ expression in moderately differentiated gastric cancer cells. (D) Positive 14-3-3σ expression in poorly differentiated gastric cancer cells (magnification, ×200).

