
Fig. 1.
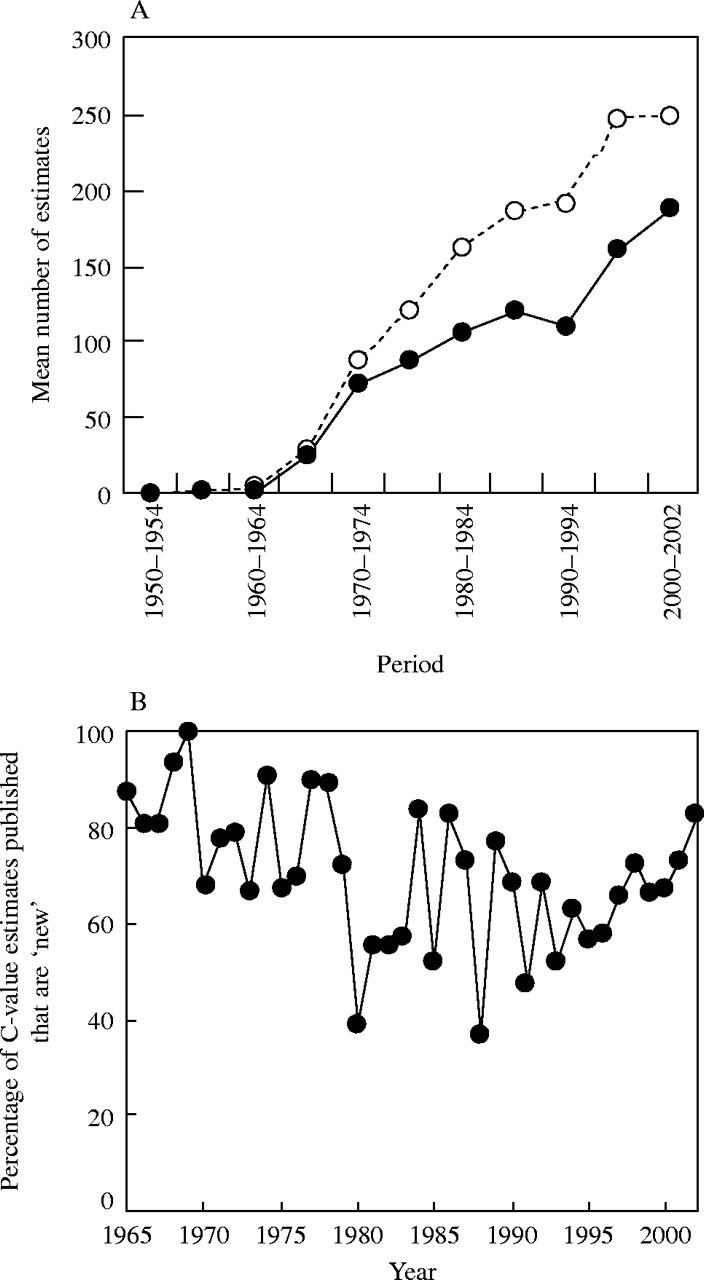
(A) Mean number per year of total (open symbols) and ‘first’ (closed symbols) DNA C-value estimates communicated in ten successive 5-year periods and the 3-year period 2000–2002, between 1950 and 2002. Based on analysis of data listed in the present Appendix table, and the Angiosperm DNA C-values database (release 4.0, January 2003). (B) Percentage of C-value estimates published or communicated during 1965–2002 that are first values for species listed in the present Appendix table and the Angiosperm DNA C-values database (release 4.0, January 2003).