
Fig. 3.
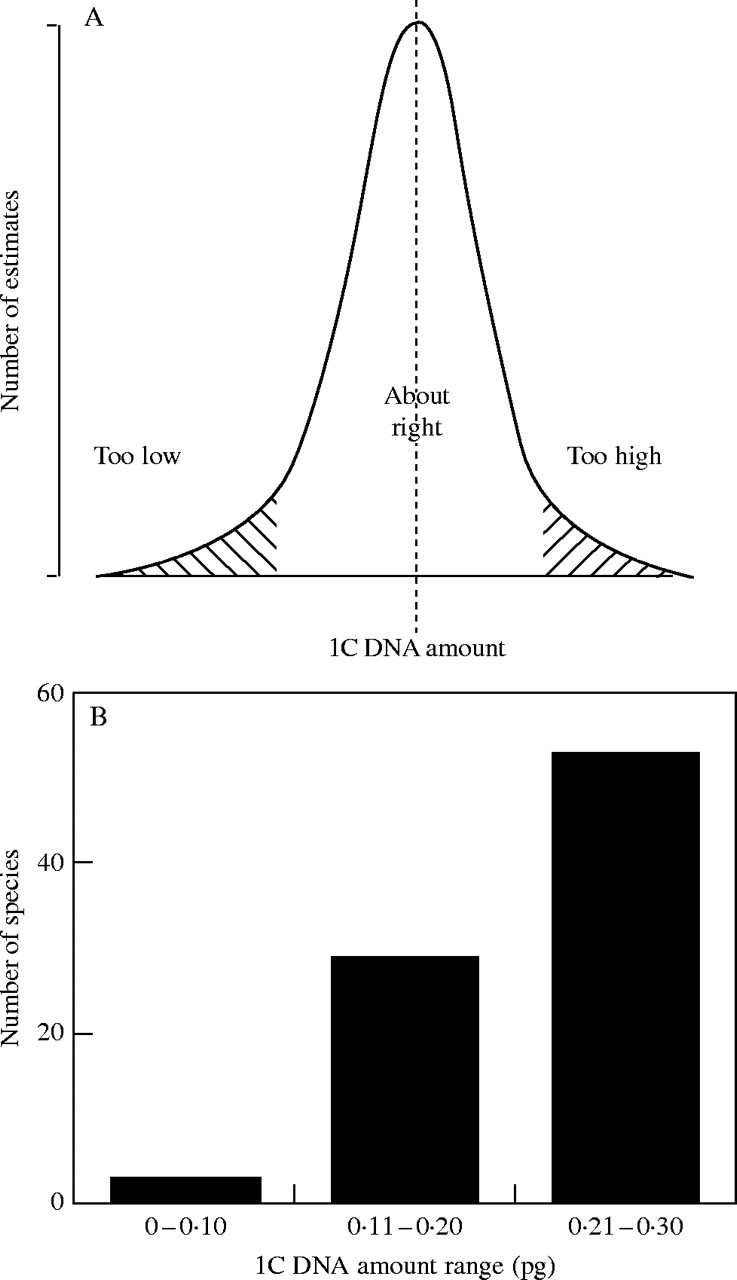
(A) Expected error variation in a large population of DNA C-value estimates for one genotype as underestimates (in the lower tail) and overestimates (in the upper tail) surround more accurate, intermediate, genome size estimates. (B) Histogram showing frequency of C-values for the 85 smallest species in the database or Appendix.