
Fig. 4.
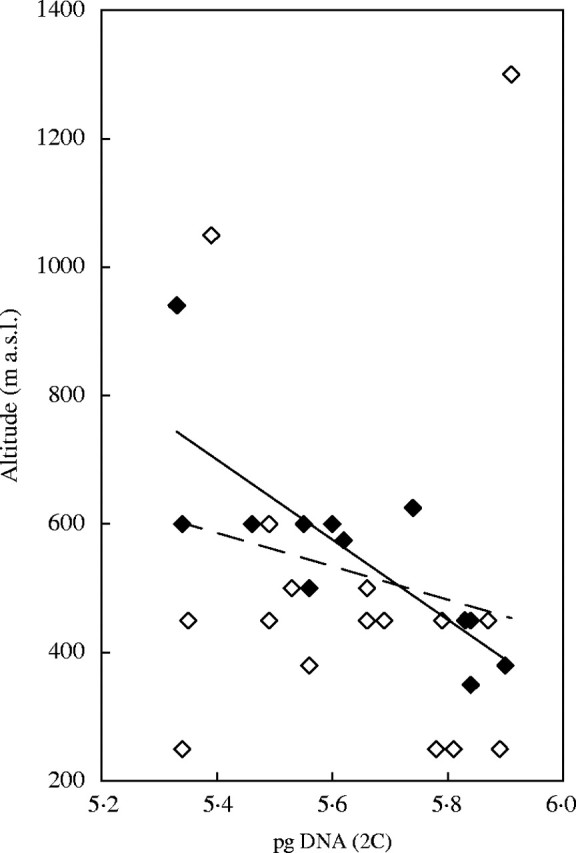
Diagram showing the available data in Arachis duranensis on the altitude above sea level of collection sites (Stalker et al., 2003) correlated against the genome size measurements by Singh et al. (1996). The data points included by Singh et al. (1996) are shown in black (r = −0·778, P ≤ 0·005), those not included are shown in white. The overall correlation is not significant (r = −0·210, P = 0·283). Original figure by E. M. Temsch.