
Fig. 1.
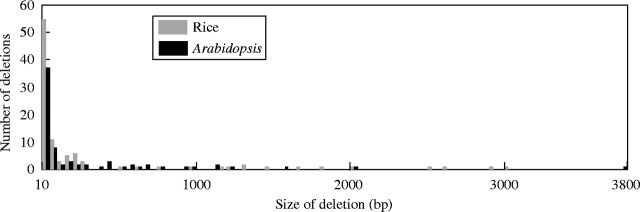
Spectrum of deletion sizes in LTR-retrotransposons of Arabidopsis and rice. Dark bars indicate Arabidopsis deletions and light bars indicate rice deletions. Deletions of specific size were pooled for this figure in ranges of 50 bp, except the first pool which records deletions of 10–50 bp. Subsequent pooled deletions sizes were 51–100 bp, 101–150 bp, 151–200 bp, etc. The data show that the respective mean and median deletion sizes were 304 bp and 50 bp for Arabidopsis, with 318 bp and 41 bp for rice.