
Fig. 4.
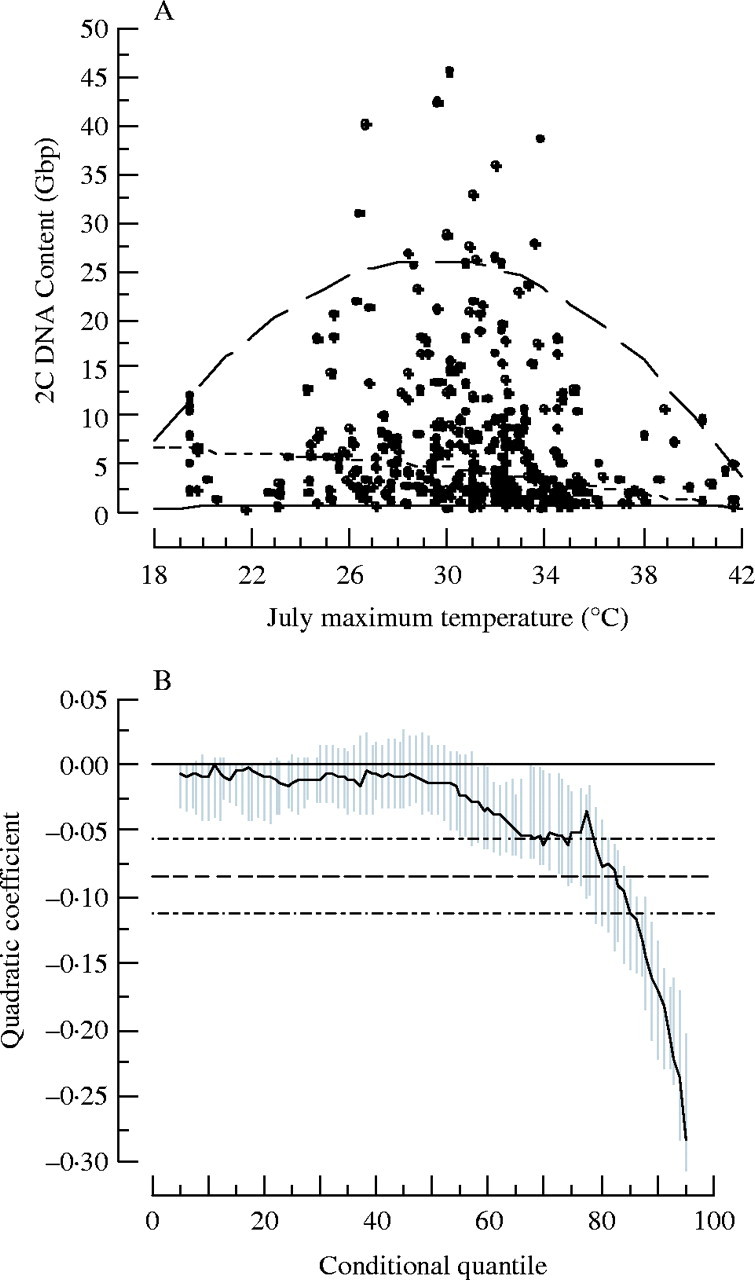
(A) Scatter plot of the mean July maximum temperature inside the range of 421 species in the California flora versus the mean 2C DNA content of those species in gigabase pairs (Gbp). (B) Quantile regression analysis of (A), showing a decreasing quadratic coefficient for increasing quantiles. The lines in A correspond to the 5th quantile (thin solid line), the 50th quantile (thin dashed line) and the 95th quantile (thick dashed line). The lines in (B) correspond to the least-squares estimate for the normal mean quadratic function for the relationship depicted in (A) (dashed line) and the confidence interval of that estimate (double-dashed line). The grey area depicts the quantile dependent confidence interval for the quadratic coefficient.