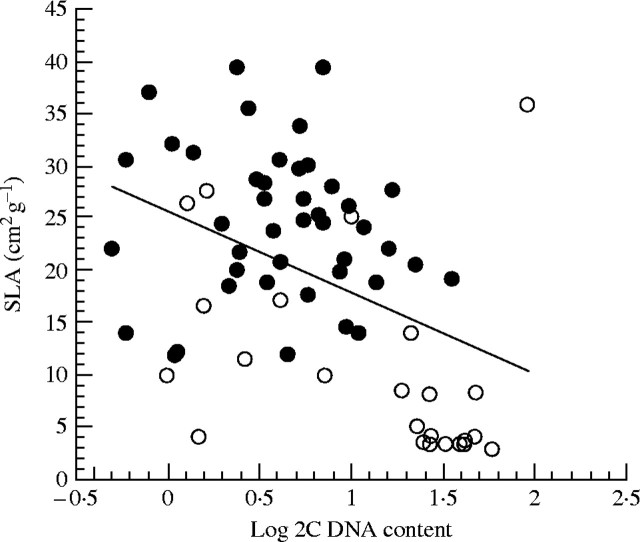
Fig. 6.
The relationship between specific leaf area (SLA) versus log of the 2C DNA content (gigabase pairs) The solid line depicts the normal least squares regression line. Data from Grime et al. (1997, solid circles) and Reich et al. (1998, open circles).

