Fig. 2.

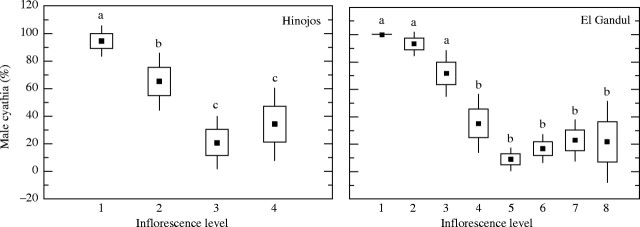
Mean proportions of male cyathia in each inflorescence level in the two populations studied. Boxes represent standard errors and the bars are 1·96 s.e. Different letters indicate significant differences at a < 0·05.

Mean proportions of male cyathia in each inflorescence level in the two populations studied. Boxes represent standard errors and the bars are 1·96 s.e. Different letters indicate significant differences at a < 0·05.