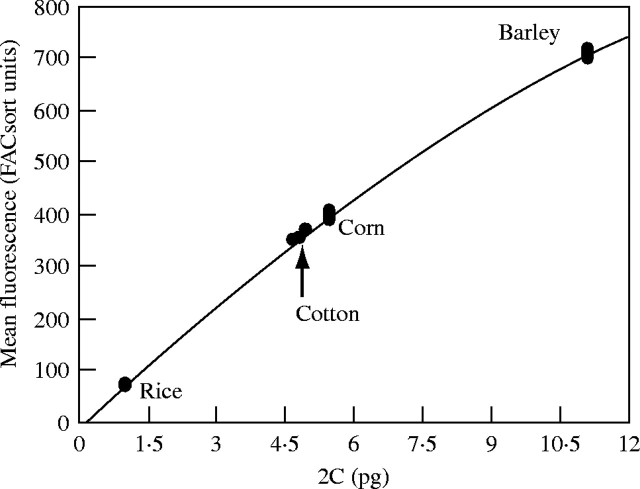
Fig. 1.
Example of standard curve used to calculate Gossypium nuclear DNA content values (n = 8 for all species). In all instances, the relationship between PI fluorescence and DNA content was better defined by a polynomial (e.g. this curve y = −1·9131x2 + 86·157x − 10·917, r2 = 0·995). The arrow highlights a set of fluorescence measurements for G. hirsutum ‘DP491’ applied to the regression equation. Cotton nuclei fluorescence is lower than that of corn (2C = 5·47 pg) and barley (2C = 11·12 pg) but higher than that of rice (2C = 1·01 pg), indicative of tetraploid cotton's genome size (2C = 4·93).

