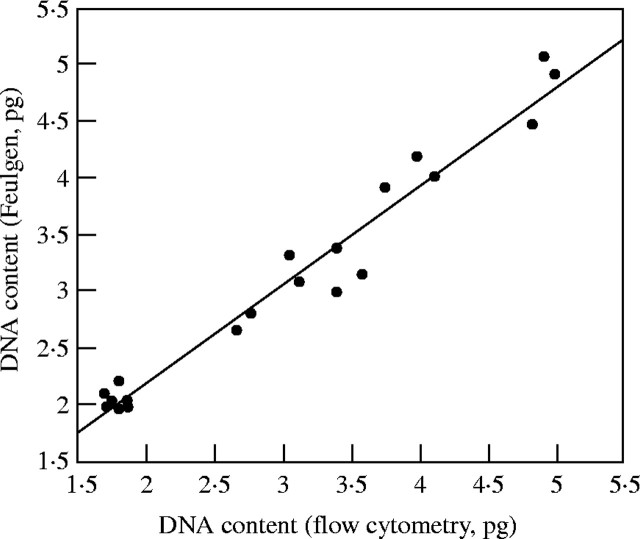
Fig. 4.
Comparison of 2C DNA content values for 20 Gossypium species determined with Feulgen microspectrophotometry (Kadir, 1976) to values reported in this study. Bennett et al. (1982) converted the arbitrary fluorescence units reported by Kadir (1976) into picograms using H. vulgare ‘Sultan’ as an internal standard. The revised values shown in this figure were derived from arbitrary fluorescence units converted into picograms using the G. arboreum DNA content reported in this study (2C = 3·5 pg). y = 0·4462367 + 0·8759436x (r2 = 0·961).

