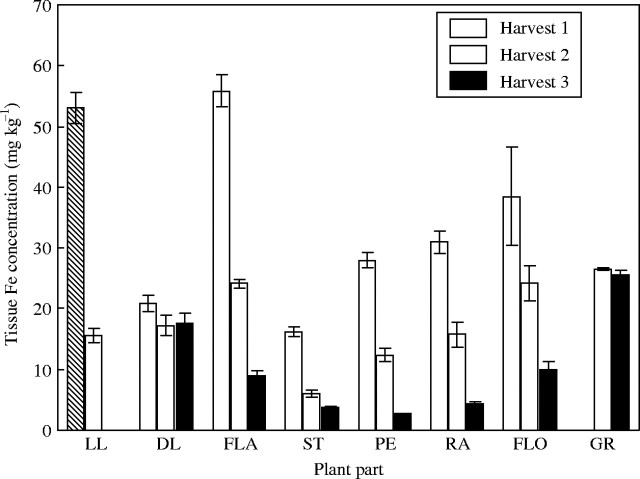
Fig. 1.
Iron concentration in tissues of control plants when harvested at anthesis (harvest 1), 18 days post-anthesis (harvest 2) and maturity (harvest 3). Values are the means of four replicates (±s.e.m.). Plant parts are: LL, lower leaves, DL, dead lower leaves; FLA, flag leaves; ST, stems; PE, peduncle; RA, rachis; FLO, florets; GR, grain.

