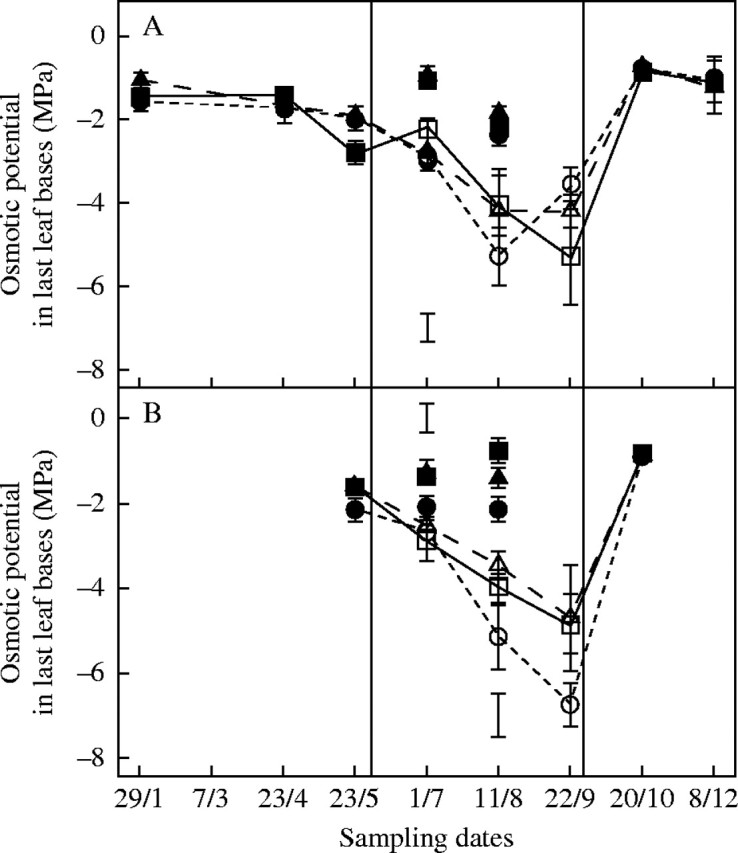
Fig. 4.

Time course of osmotic potential (MPa) in last leaf bases over the year 2003 in three genotypes of cocksfoot: the drought-resistant cultivar ‘Kasbah’ (circles); the drought-sensitive cultivar ‘Oasis’ (squares) and the ‘Oasis’ × ‘Kasbah’ hybrid PG325 (triangle) subjected to progressive drought from 31 May to 22 September (open symbols) or fully irrigated over the same period and the rest of the year (closed symbols) in a field experiment when plants were sown in autumn (A) or in spring (B). Bars indicate l.s.d. when differences between genotypes are significant at P < 0·05. Bars at the bottom of the figure refer to irrigated treatments, while those at the top of the figure refer to the drought treatment.
