
Fig. 3.
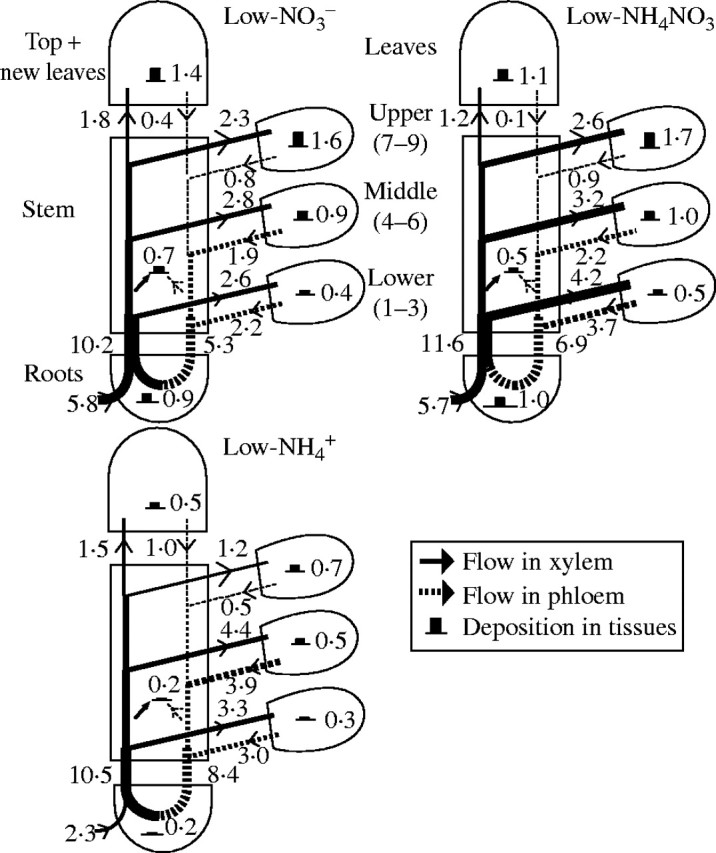
Flow profiles for uptake, transport and utilization of K+ in tobacco plants supplied with a low nutrient concentration (2·5 mm K and 2 mm N) over a 10 d experimental period, starting 106 d after sowing. The values of K+ deposition and the statistical significance are given in Table 3. The width of arrows and the height of histograms are drawn in proportion to the net flows and deposition of K+. The numbers indicate the values of uptake, transport and utilization (mmol K+ per plant over the 10 d study period).