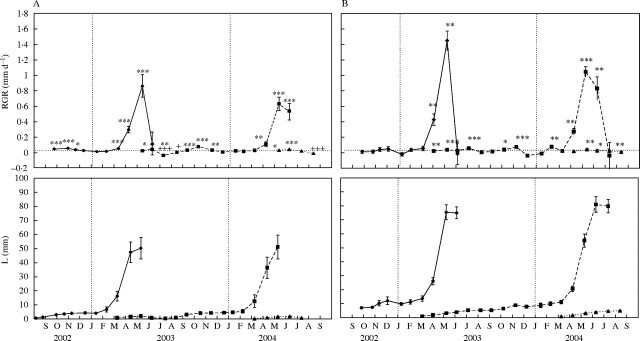
Fig. 4.

Relative growth rate dynamics (top) and mean length of the shoots (bottom) of (A) Lepidium subulatum and (B) Linum suffruticosum. Values are means of 15 shoots ± s.e. Solid lines represent shoots recorded in 2002, dashed lines are those from 2003, and dotted lines are those from 2004. Asterisks indicate RGR values significantly higher than zero (*P < 0·05, ** P < 0·01, ***P < 0·001) and crosses indicate RGR values significantly lower than zero (+ P < 0·05, ++ P < 0·01, +++ P < 0·001), after a Student's t-test, in case of normal data, or by Wilcoxon t-test otherwise.
