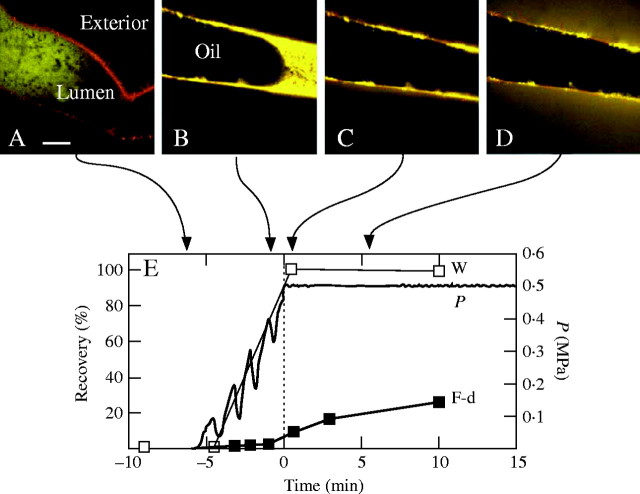
Fig. 2.
Sequence of P development when FITC–dextran is supplied to the lumen inside an isolated Chara cell wall. (A) Confocal microscope view of 38-kDa FITC–dextran solution (yellow) being injected by a pressure probe into the lumen of the flaccid wall (pre-stained with Congo Red). Scale bar = 100 μm. (B) Mineral oil (Oil) follows the FITC–dextran. Yellow fluorescence is more intense than in (A) indicating concentration of the injected dextran as oil fills the lumen and P rises. (C) P reaches 0·5 MPa and is held constant. FITC–dextran is pressed against the inner face of the cell wall. (D) After P of 0·5 MPa for 5 min, some FITC–dextran has passed through the cell wall and appears in the unstirred water outside. (E) Quantitative analysis of FITC–dextran (F-d) and water movement (W) as P develops in (A) to (D). Ordinate on left indicates recovery as a percentage of the supplied water or dextran, and on right indicates P applied to F-d solution. Time = 0 (vertical dashed line) when P reaches 0·5 MPa.

