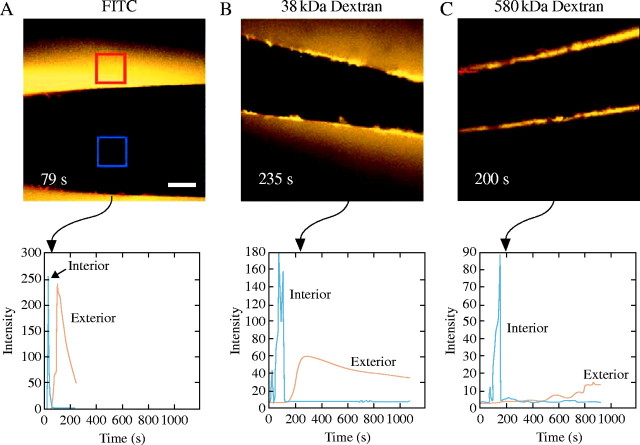
Fig. 4.
Molecular weight dependence for movement of molecules across Chara cell wall. (A) Confocal microscope view of unconjugated FITC after 79 s of artificial P of 0·5 MPa. Scale bar = 100 μm. Changes in FITC signal were measured continuously within 100 μm × 100 μm squares in the image and plotted in the graph below the image. Blue square in image, blue trace in graph shows fluorescence in the lumen; red square in image, red trace in graph shows fluorescence in unstirred exterior water. Rate of FITC movement into lumen reaches a peak at 20 s but reaches a peak in exterior water at 79 s. (B) Same as (A) but with 38-kDa FITC–dextran. After 235 s of observation, 38-kDa FITC–dextran is seen concentrated in or near the wall but is slowly moving from the lumen to the outside through the wall (image). FITC–dextran is still moving slowly at 1100 s (graph). (C) Same as in (A), but for 580-kDa FITC–dextran. Little or no FITC–dextran is detected after 200 s (image) or longer times (graph).

