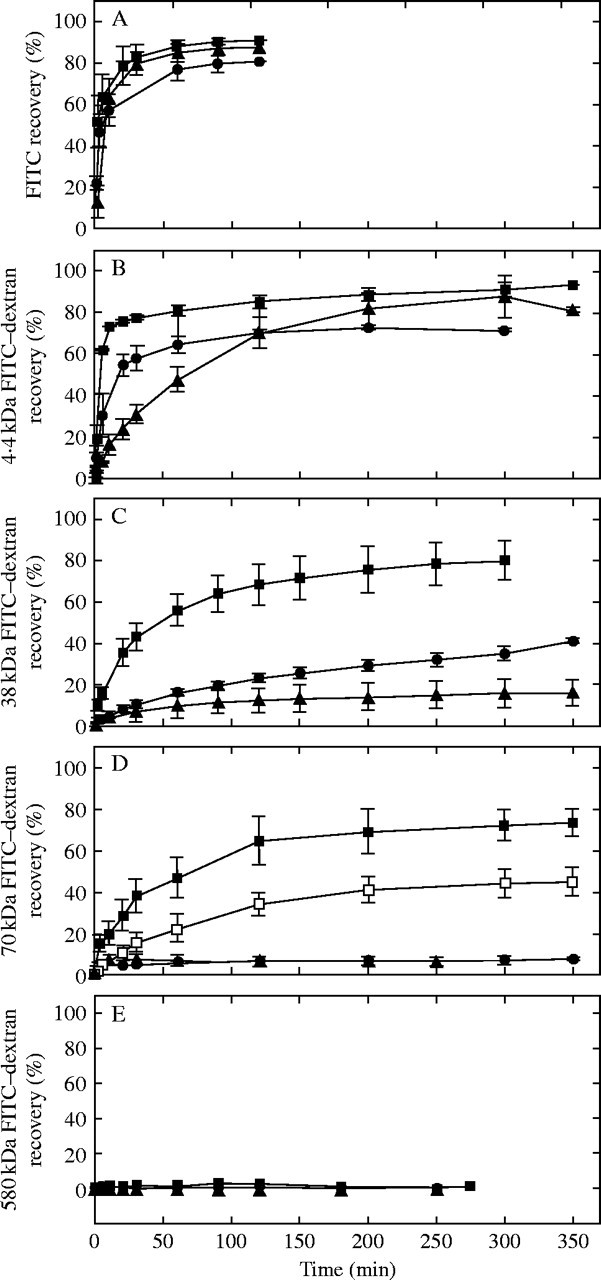
Fig. 5.

Movement of aqueous FITC or FITC–dextran of various molecular weights through isolated Chara walls at various steady P. (A) Time course of movement of FITC (0·389-kDa) at P of 0·05 MPa (triangles), 0·25 MPa (circles) or 0·5 MPa (squares). (B) Same as (A) but with 4·4-kDa FITC–dextran. (C) Same as (A) but with 38-kDa FITC–dextran. (D) Same as (A) but with 70-kDa FITC–dextran and including a measurement at P of 0·35 MPa (open squares). Measurements at P of 0·05 and 0·25 are often coincident and appear as single points. (E) Same as (A) but with 580-kDa FITC–dextran. Recovery (%) on ordinate is the percentage of the injected test solution that was recovered in the stirred bathing water. Time zero on the abscissa is when stable P was established. Each point is a mean ± 1 s.e. for n = 3 walls.
