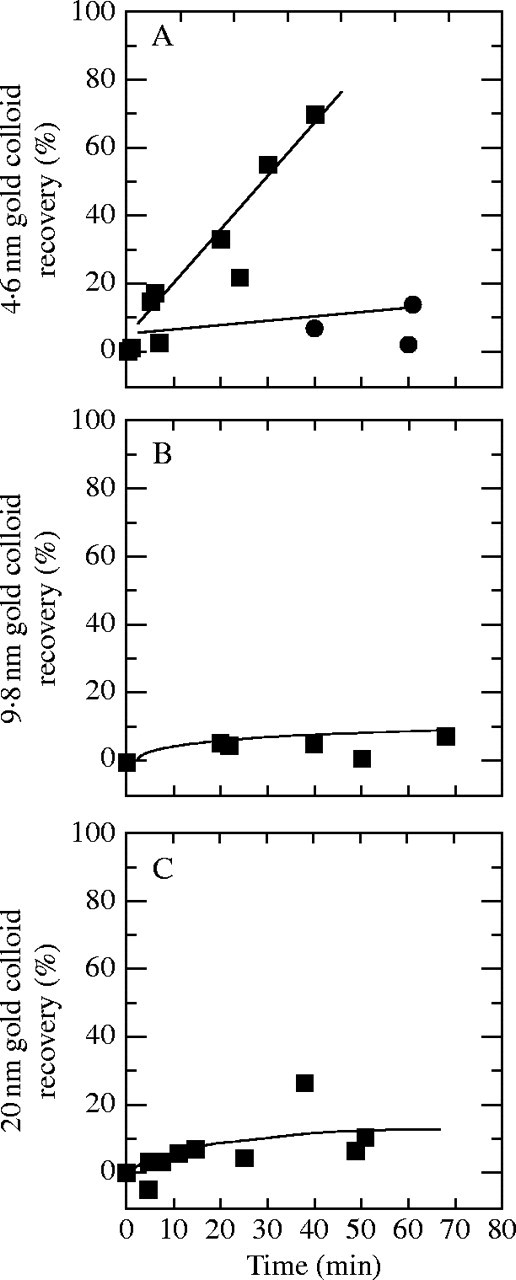
Fig. 6.

Movement of colloidal gold through isolated walls from growing internode cells of Chara at various steady P. (A) Gold with 4·6 nm diameter and P of 0·5 MPa (squares) or 0·25 MPa (circles). (B) Same as (A) but with gold of 9·8 nm diameter at P of 0·5 MPa. (C) Same as (A) but with gold of 20 nm diameter at P of 0·5 MPa. Recovery shown on ordinate is percentage of total colloid injected. Each point represents a single wall from a separate cell.
