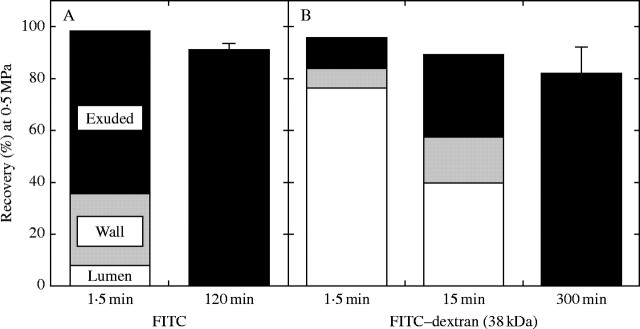
Fig. 8.

FITC and FITC–dextran compartmentation when P was held at 0·5 MPa for 1·5 min. Isolated cell walls of Chara were injected with (A) unconjugated FITC or (B) 38-kDa FITC–dextran. Fluorescence was measured in the bathing water (Exuded), in solution flushed from the lumen after the end of the cell wall was excised (Lumen) and in an extract of the wall (Wall). In (B), this analysis was also made when P was held at 0·5 MPa for 15 min. Data are from one of three replicate trials that produced similar results. The total from these locations was compared with the total collected in the external water after 120 min (A) or 300 min (B) of movement through the isolated cell wall as in Fig. 5 (means ± s.e. of three replicate trials).
