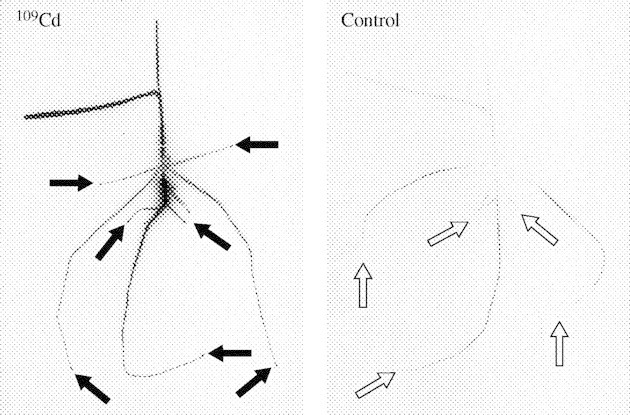
Fig. 5.

Distribution of 109Cd in young wheat plants 4 d after labelling the main root (autoradiographs). The labelled plant is shown at the left side and the identically treated but initially unlabelled control plant is shown at the right side. The root tips of the plant supplied with 109Cd were strongly labelled (black arrows), while no such accumulation was observed in the tips of the control plant (open arrows).
