
Fig. 4.
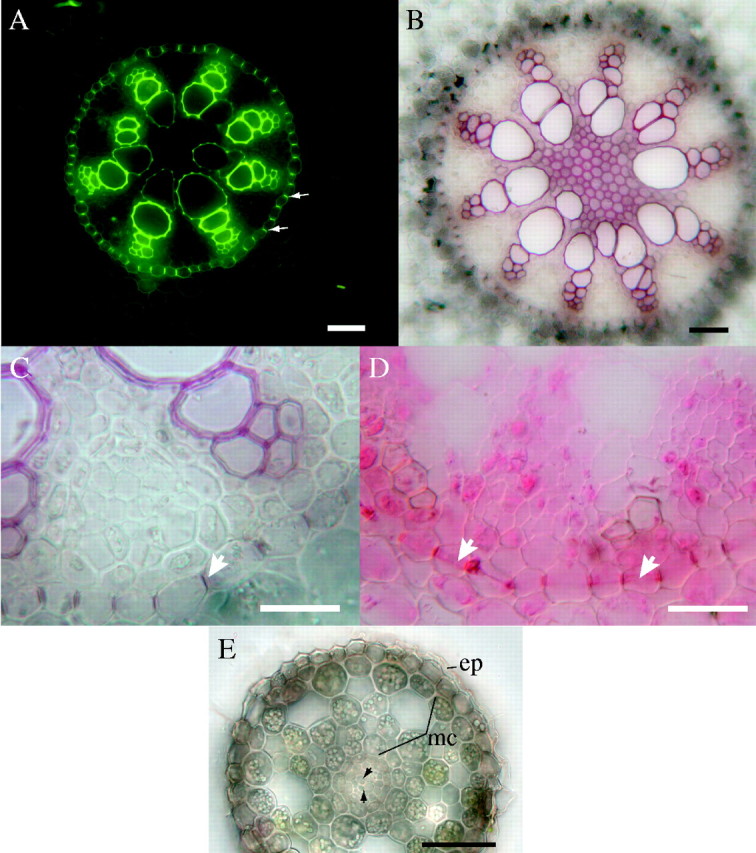
Central cylinders in cross-section in basal part of a well-established root (27 cm long); fresh sections. (A) Autofluorescence under blue excitation. Arrows indicate Casparian bands. Scale bar = 50 μm. (B) Lignified xylem with sclerenchyma in centre of stele; HCl–phloroglucinol. Scale bar = 50 μm. (C) Casparian bands (e.g. arrow) observed in endodermis; HCl–phloroglucinol. Scale bar = 50 μm. (D) Casparian bands observed in endodermis; arrows indicate protoplasts showing band plasmolysis; sudan red 7B. Scale bar = 50 μm. (E) Cross-section of determinate nodal root 30 mm from the root tip showing sloughing epidermis (-ep) and reduced middle cortex (mc). Central cylinder (cc) contains only reduced vascular tissues (arrowheads); differential interference contrast optics. Scale bar = 50 μm.