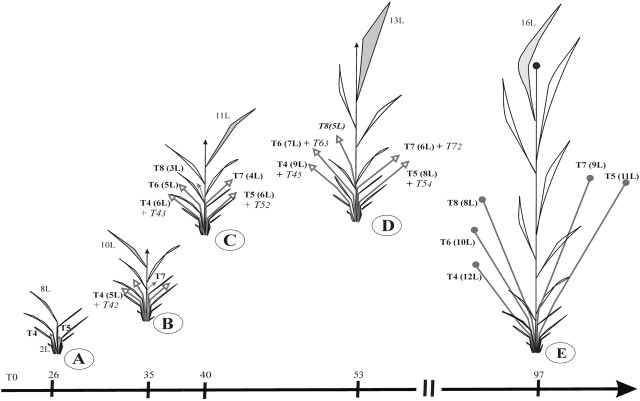
Fig. 11.
Schematic diagram of rice development at different stages characterized by the number of leaves on the MS with reference to days after sowing. The number of emerged leaves on the tillers is indicated in brackets (xL). Primary tillers are represented in bold (Tx), secondary tillers in italics (TXy). (A) 8 leaves (8L) = emergence of first primary tillers (T4, T5). (B) 10L = emergence of first secondary tillers (Txy). (C): 11L = most of the primary tillers are emerged. (D) 13L = most of the secondary tillers are emerged. (E) 16L = heading on the MS and primary tillers.

