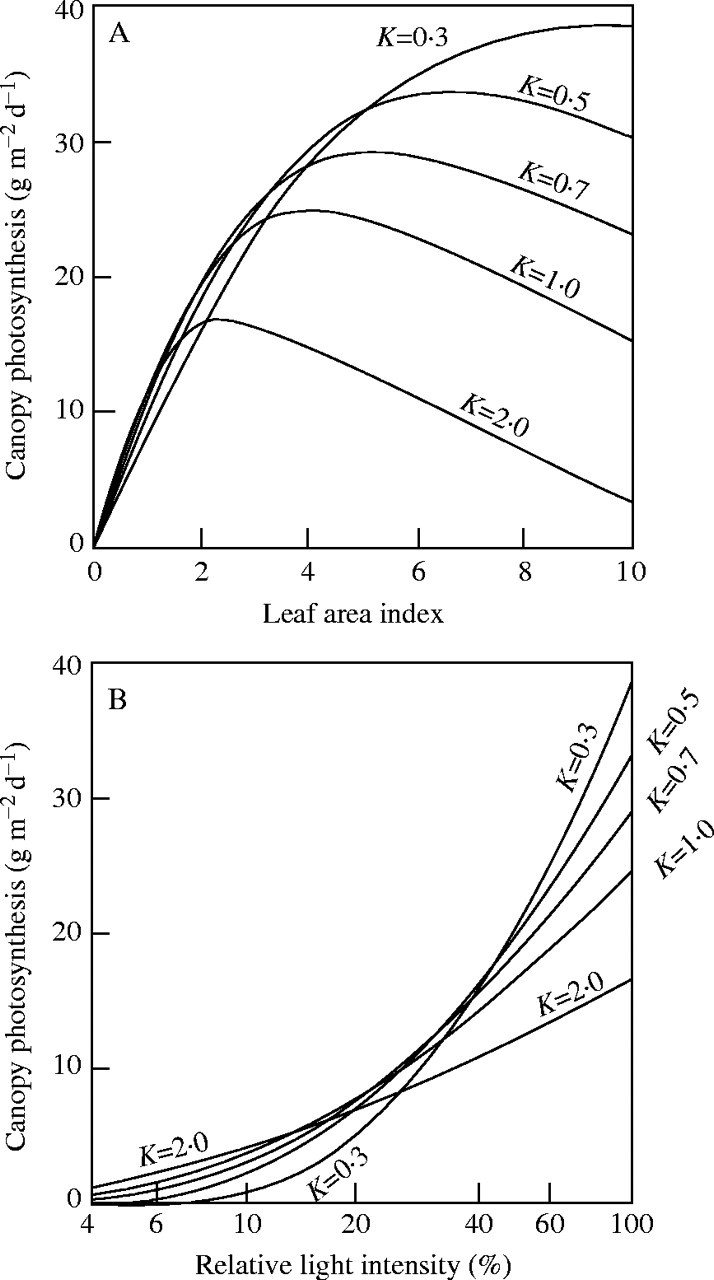
Fig. 2.

(A) Daily canopy photosynthesis of a Celosia cristata stand under full daylight (100 %) calculated from eqn (4), plotted as a function of leaf area index. Different K-values are assumed. (B) Daily maximum canopy photosynthesis as a function of relative incident radiation. Calculated from eqn (8) for different K-values. Redrawn after Saeki (1960).
