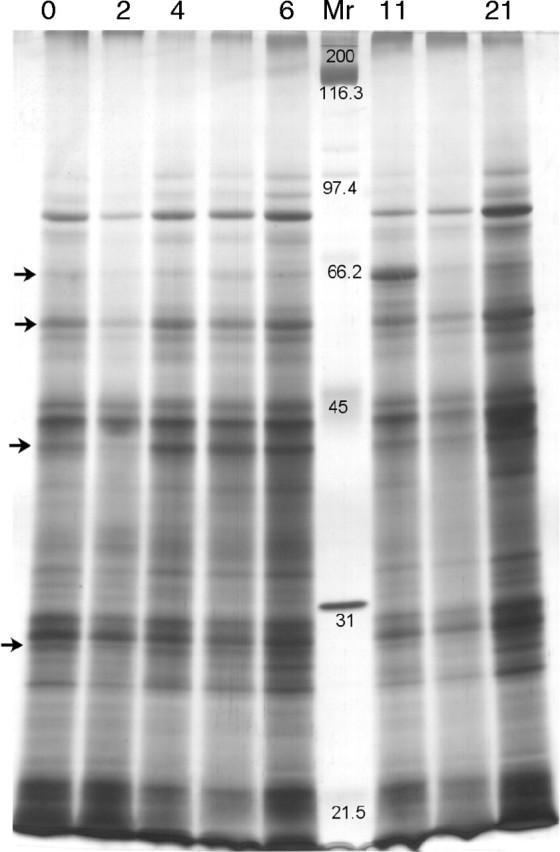
Fig. 4.

One-dimensional SDS–PAGE profile of soluble proteins from roots of C. epigejos plants during regrowth after defoliation. The numbers above the lanes refer to sampling day (days after defoliation). Lanes without numbers are not presented in the Results section. The positions of molecular weight markers (kDa) are depicted in the ‘Mr’ lane. The positions of bands affected by defoliation (63·5, 55, 41 and 28 kDa) are indicated by arrows. The same amount of total soluble protein was loaded into each well and proteins were visualized by silver staining.
