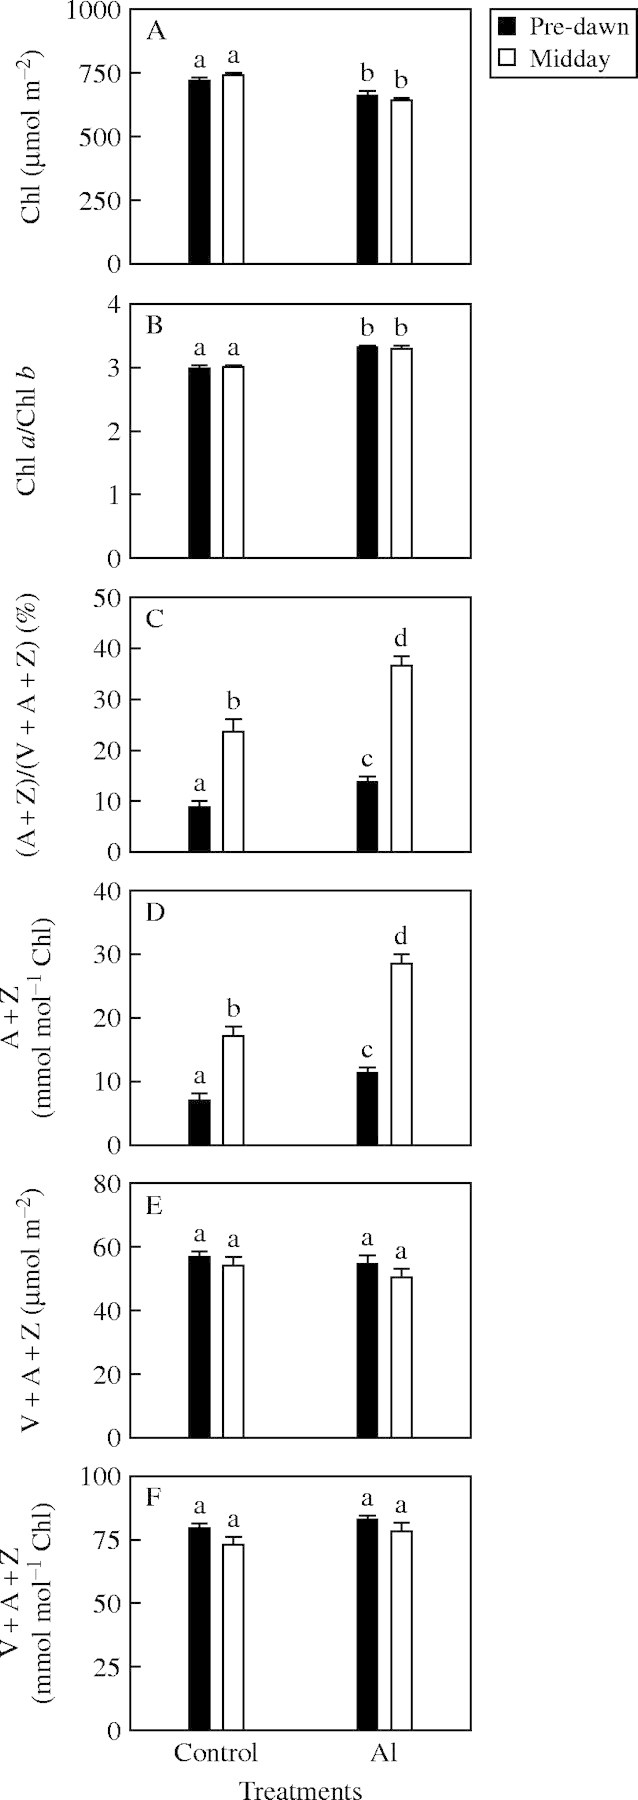
Fig. 2.

(A) Chlorophyll (Chl); (B) Chl a/b; (C, D) A + Z expressed on the basis of xanthophyll cycle pool or Chl; and (E, F) xanthophyll cycle pool expressed on the basis of area or Chl before dawn and midday in Al-treated and control leaves. Bars represent mean ± s.e. (n = 7). Significant differences were tested between pre-dawn and midday data for the same type of leaves, and Al-treated and control leaves taken at the same time. Different letters above the bars indicate a significant difference at P < 0·05.
